Owning Your Instrumentation Layer in Postgres so No Vendor Dashboard Holds Your Metrics Hostage
Keep metric definitions in your own Postgres so tools stay swappable.
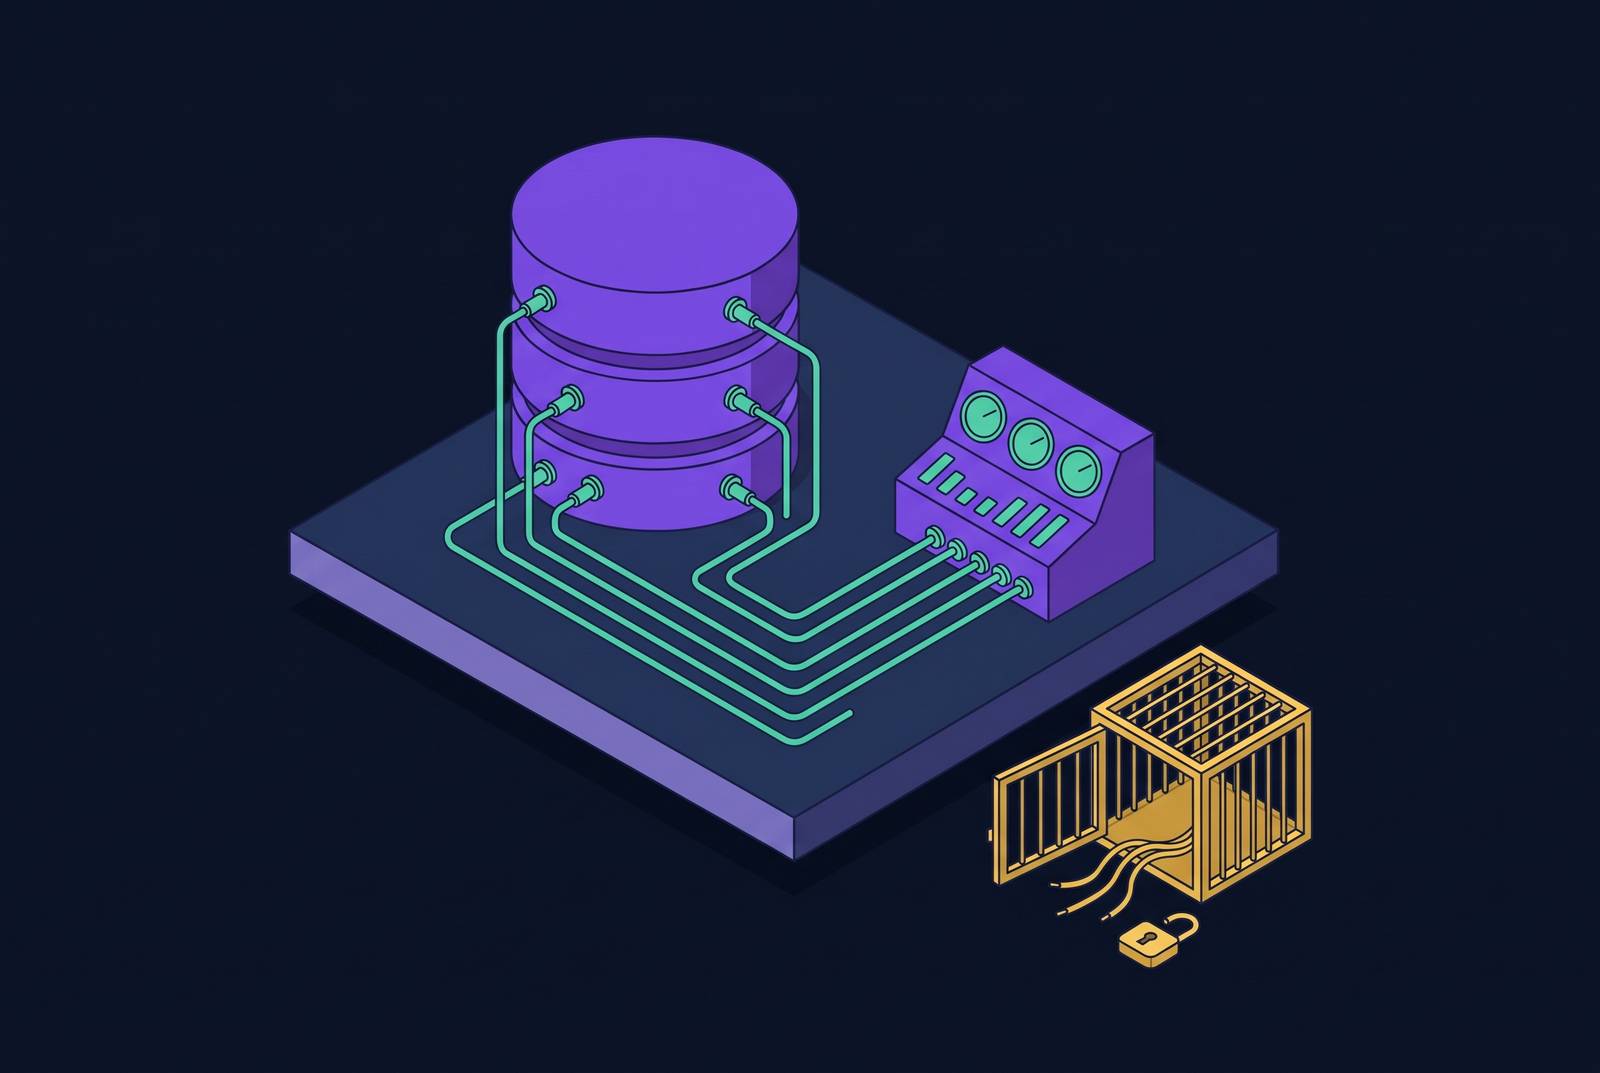
For API-first and agent-first teams, a headless analytics backend should keep metric definitions in team-controlled Postgres models and expose governed outputs through an API or MCP server, without requiring a dashboard UI. Owning the instrumentation layer solves a custody problem. When definitions, history, and access controls are kept separate from the frontend, a team can replace a monitoring tool or add an AI agent without rebuilding the metrics.
Why your metrics belong to you, not to the tool that calculates them
A team leaves its monitoring vendor and discovers that its p95 baselines and incident history are gone. The database remains, but the record of how it behaved does not. Alert thresholds and the definitions behind familiar charts were part of the subscription. The team bought visibility without retaining custody.
A metric includes the calculation that produced it and the history that makes it useful for comparison. When those live only in a vendor’s schema, ending the contract can separate the team from both. A product acquisition can create the same exposure.
Most startups building on Postgres already own the raw telemetry, including system statistics, WAL events, and query traces. But they may not own the pipeline that turns those inputs into records they can keep. Teams can also own their business records without owning the metrics built from them. Query latency, ARR, and churn all become dependent on an outside system when their definitions live there alone.
What Postgres already exposes before any tool touches it
pg_stat_activity shows each connection as a row, with session state and wait events that distinguish active work from idle connections. An “idle in transaction” session can hold an old transaction ID open, preventing autovacuum from reclaiming storage. Joining this view with pg_locks shows which process is blocking others in lock contention. The aggregate chart does not explain that mechanism.
pg_stat_statements reveals another distinction that slow-query lists can obscure. The cumulative execution statistics in pg_stat_statements show how cheap queries that run often can use more total database time than slow ones that run only now and then. PostgreSQL 16+ adds pg_stat_io, which separates I/O by backend type and context, including normal, bulk read, bulk write, and vacuum. High bulk-read latency can indicate sequential scans saturating the storage bus.
Vacuum can remove only dead rows older than the oldest xmin held in the system. A pinned horizon explains how autovacuum can run constantly while bloat grows, yet a dashboard will miss it unless specifically instrumented. Other signals that teams can read directly include active connections against max_connections, cache hit ratio from pg_statio_user_tables, replication lag from pg_stat_replication, and lock waits. These give latency measurements the context needed to explain deterioration.
The minimum viable self-owned instrumentation stack
Enable pg_stat_statements through shared_preload_libraries, enable track_io_timing to capture I/O duration, and add auto_explain. A dedicated read-only monitoring user with the pg_monitor role separates statistics access from application credentials. Establish one alert each for p95 latency, connection saturation, and replication lag. Regular review of queries ranked by cumulative execution time supplies the workload baseline.
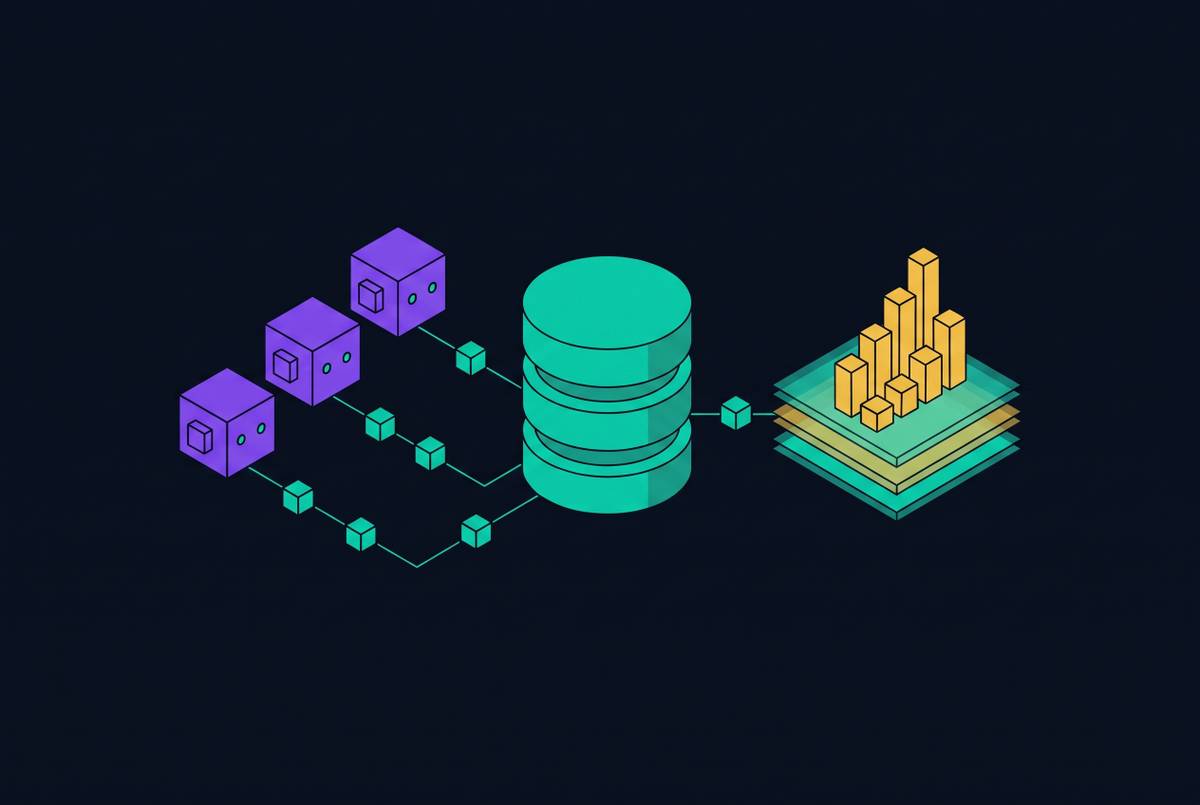
The architecture then separates extraction, collection, storage, and display. postgres_exporter queries the catalog and exposes Prometheus metrics, while Prometheus stores the time series in infrastructure the team controls. Grafana can read that store without becoming its custodian. Grafana Alloy has a standards-compatible collection layer that links database monitoring with distributed tracing. Each component has a distinct role.
Another way to collect on the server side is to use a telemetry collector’s PostgreSQL receiver with the monitoring user, which lets the team see what happens at the database level without changing application code. Collection cadence still determines what survives. Collecting every second catches short spikes and lock storms that minute-range polling can average away until they are too small to trigger an alert. With collection writing to controlled storage and visualization reading from it, replacing the display does not erase the history.
Where vendor monitoring tools help and where they create the custody problem
Pre-built dashboards provide immediate visibility without requiring custom queries. Unified tools also connect signals that are difficult to interpret separately, such as a p99 latency spike, a SQL statement, and a deployment event. Building that causal chain requires real effort. A team without the capacity to operate its own infrastructure can reasonably choose a vendor to provide it.
The custody risk appears when that convenience becomes the only home for metric logic. New Relic uses NRQL to power queries, dashboards, and alerts. Those definitions are not directly portable to another system, so leaving requires more than replacing a chart.
With OpenTelemetry’s unified data model, a pipeline can collect Postgres metrics, application traces, and infrastructure signals for a backend that the team controls. The team still has to do the work of building correlation that helps explain what happened. It does, however, separate that work from a requirement to keep every signal inside one vendor’s system.
pgwatch as the reference architecture for self-owned, portable Postgres observability
Cybertec maintains pgwatch as an open-source, self-hosted implementation of this separation. Its metric definitions are plain SQL files that the team can use outside a dashboard editor. Its outputs can go to PostgreSQL, Prometheus, JSON, or a custom gRPC-based backend. The team can choose where to store the data without the display making that choice for it.
That separation makes pgwatch a useful reference for teams evaluating custody. It ships with Grafana dashboards and a web admin UI, but neither must own the historical record. A team can retain the SQL definitions and controlled data sink while changing its visualization layer. Moving between cloud providers likewise need not discard the metric logic or stored history. Portability follows from where those assets live.
As pgwatch illustrates, an observability tool can provide a usable interface while leaving its metrics open to interpretation by other tools. For self-hosted Postgres monitoring, pgwatch demonstrates that arrangement concretely. For teams assembling their own stack, the same properties provide criteria for comparing components.
What analytics infrastructure gives Supabase teams raw access and owned instrumentation?
Supabase exposes a Prometheus-compatible Metrics API with Postgres performance and health series. The endpoint gives the team raw monitoring inputs, but whether it owns the history depends on how it collects and stores them. Supabase Studio has aggregate tiles, which do not give the team a complete query-level incident record. Connection spikes, slow queries, and replication problems therefore require more detailed instrumentation.
For self-hosted Supabase, the recommended stack uses Prometheus for time series, Grafana for visualization, and Loki for logs. Exporters include postgres_exporter, node_exporter, and Kong’s built-in Prometheus endpoint. This keeps data from the database, host, and gateway separate so the team can read each on its own or alongside the others. Seeing what happens at the query level helps because applications can hit query, indexing, or schema limits before they use all the platform’s capacity. Aggregate resource totals cannot explain every performance constraint.
That data also informs when read replicas are appropriate, including when analytics queries hurt production, workloads are predominantly reads, or international users face meaningful network latency. For expensive aggregates, materialized views offer another route. They compute results ahead of dashboard or report requests and store them in a table the team controls. One team using this approach on Supabase reduced dashboard load time from twelve seconds to 200ms. The same database object can also become the owned definition of a business metric.
Extending self-owned instrumentation from operational metrics to business KPIs
A metric defined in a Postgres materialized view or governed dataset belongs to the team. A metric defined only in a BI vendor’s formula editor is rented. This occurs when sales, finance, and product each keep their own version of ARR. They may agree on the records but disagree on how to calculate the metric. Without one controlled definition, the executive team’s debate over numbers displaces debate over decisions.
The practical requirement is reconciliation to an authoritative source. ARR should reconcile to the billing system, cash to the bank, and product usage to the analytics layer. With materialized views and pre-calculated aggregate tables, Postgres can hold the SQL that calculates monthly recurring revenue or weekly active users. Dashboards then read the pre-calculated result.
A governed Parquet dataset exported from Postgres and queryable through DuckDB can serve human dashboards and AI agents from the same pre-modeled source. Agents can make requests without reaching the production database. As the business grows, its chosen KPIs can change without changing that custody model.
Why agent access to data makes metric custody a security question, not just a philosophy one
Once agents consume metrics, ownership also determines what they may read, calculate, and act on. A direct production connection gives an agent the access granted by its connection credentials. That connection on its own does not give the team per-user scoping, a query-level audit trail, or metric-specific authorization. A shared definition is therefore only part of the solution. Its delivery path must also enforce governance.
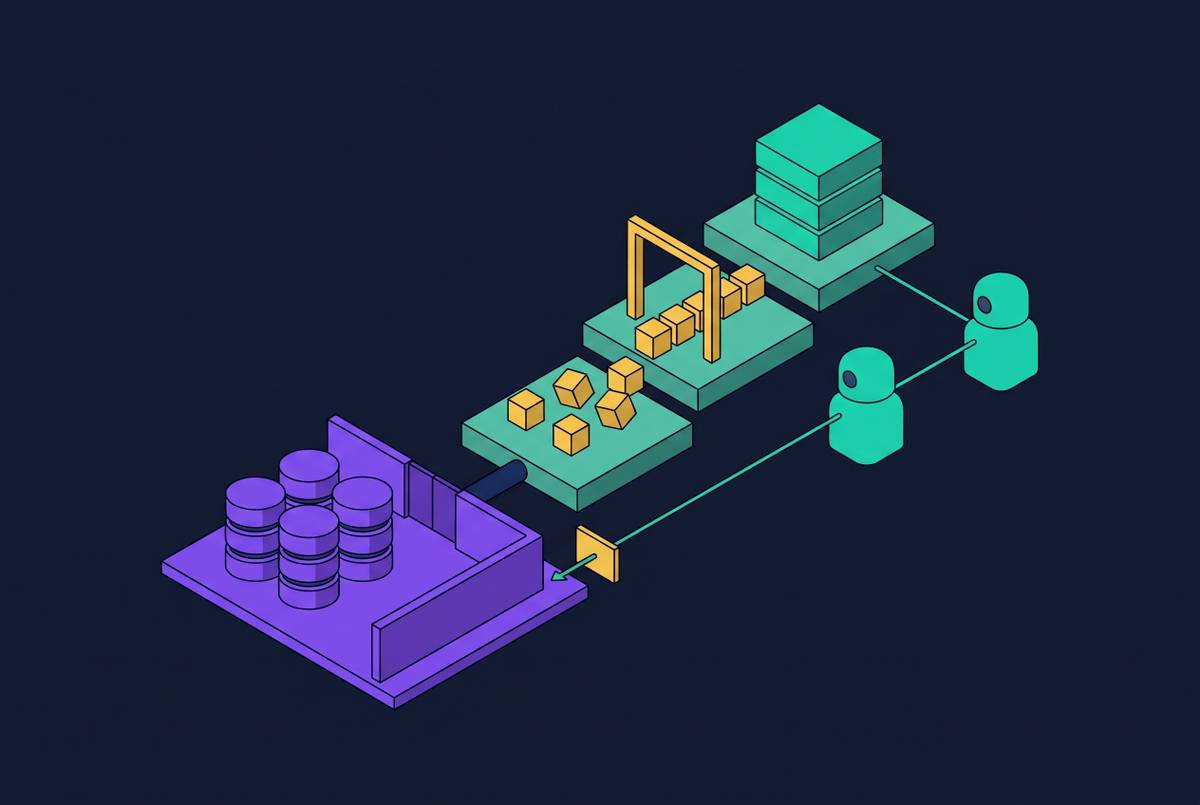
A safer approach is to put a governed analytical copy behind an API or MCP server. Agents discover available datasets and request them by name through that governed interface. Pre-calculated Parquet datasets queried through DuckDB provide context without adding production connection-pool pressure. The backend enforces permissions and logs access, directing requests to isolated read replicas or pre-modeled datasets. This applies the same separation of privileges as the operational monitoring user.
Salesforce Headless 360, announced at TrailblazerDX on April 15, 2026, exposes Salesforce data, workflows, and business logic through APIs and MCP tools without requiring a browser. ZoomInfo announced general availability of GTM.AI on June 1, 2026, describing a headless GTM context layer that exposes its graph through an API and the Model Context Protocol. These address Salesforce workflows and GTM context respectively, rather than serving as interchangeable Postgres monitoring backends. Their shared architectural premise is governed access without dependence on a UI.
For a team adding usage analytics to an AI agent, the corresponding foundation is its own pre-modeled usage dataset exposed through a controlled endpoint. A single MCP server can serve the same definitions that human dashboards consume. The instrumentation layer then grounds operational decisions, business reporting, and agent responses.
What to build first, and in what order
Teams should build in the order that operational risk calls for, starting with the data they will need in the next incident. This week, enable pg_stat_statements and auto_explain, and create a dedicated read-only monitoring user with pg_monitor. For Supabase, scrape the Metrics API into Prometheus storage the team controls. Set one alert each for p95 latency, connection saturation, and replication lag. Start with a small, usable incident foundation.
This month, build historical query baselines so the team has more than current statistics to work with. Run a weekly query against pg_stat_statements that ranks statements by cumulative execution time, and store the results in a controlled Postgres table. Add xmin horizon tracking to expose vacuum constraints before they produce growing bloat. These records make later incident comparisons possible.
This quarter, move core business definitions into materialized views or scheduled queries that store their results in Postgres. ARR, WAU, and activation rate can then become versioned database definitions rather than formulas maintained separately in reporting tools. When agents enter the workflow, export pre-calculated datasets that can be queried without production connections. Expose those governed outputs through a single API, MCP server, or both. Every definition should remain readable without paying a vendor to interpret it, whether the next consumer is a dashboard, an inbox, or an agent.