Headless Analytics vs Traditional BI Tools for Developer Teams
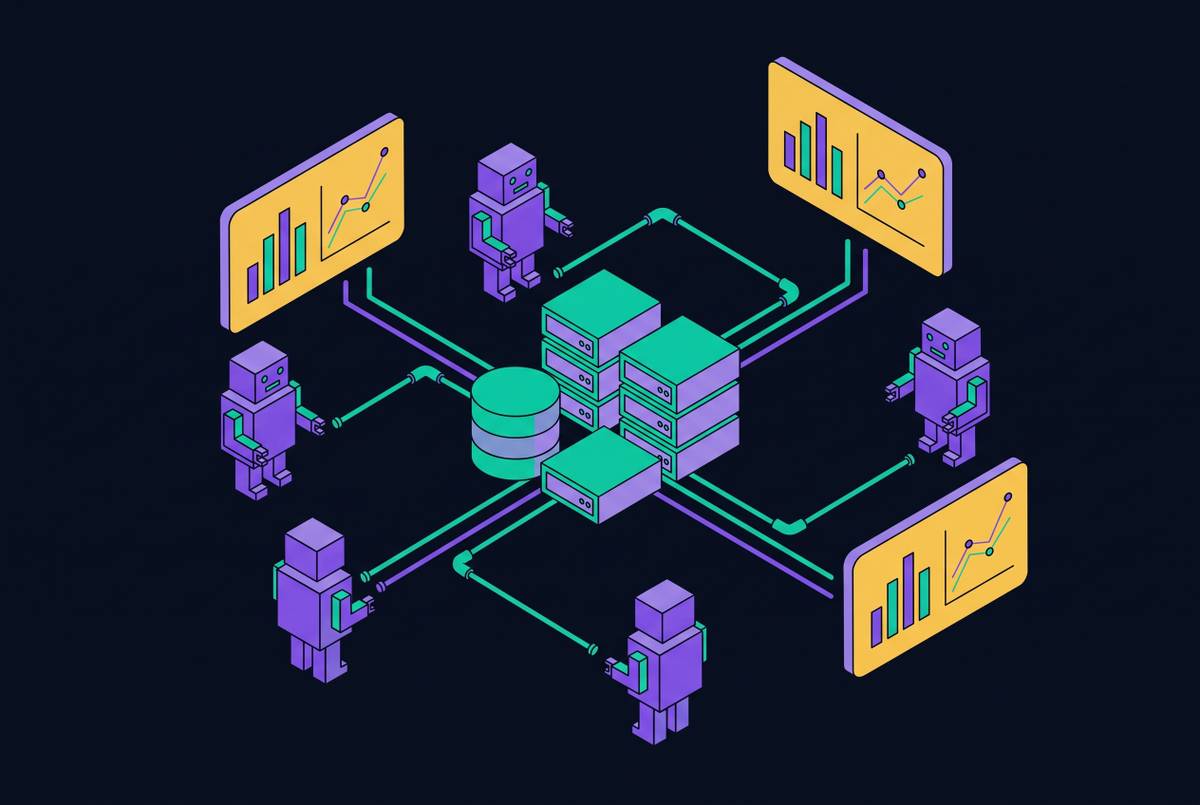
Headless analytics lets developer teams reuse metrics across dashboards, apps, and AI agents.

For API-first and agent-first developer teams, headless analytics combined with a governed semantic layer is the architectural fit when they need a callable analysis engine without an opinionated frontend. Traditional BI tools become a constraint when metric definitions remain tied to their presentation layer. The choice is not primarily about dashboards, but whether the same trusted analytics can serve applications, automated workflows, and AI agents.
Why traditional BI tools create an architecture problem for developer teams
A developer needs to surface MRR in a dashboard, a Slack alert, and an AI agent. If the calculation exists only inside the BI tool, the developer must write it again for the other consumers. Each version then has its own definition to keep up to date.
One engineer calculates revenue with SUM(revenue), while another uses SUM(amount_captured), and the two consumers return different answers. Neither interface necessarily reveals the discrepancy. Business users may encounter it as conflicting reports, but developers inherit it as duplicated logic across APIs, pipelines, agents, and custom applications. Each new consumer adds more work to keep the logic up to date because it must write out a business rule.
BI tools can offer APIs and embedding options. Those capabilities are useful, but they do not by themselves resolve the architectural issue. An endpoint that returns chart data is different from a semantic layer that exposes governed metrics with access control and caching. The distinction is what the API makes reusable. Sending the output of an existing visualization may still leave other systems without a way to request the metric on their own under the same rules.
What headless analytics and headless BI actually are, and where they differ
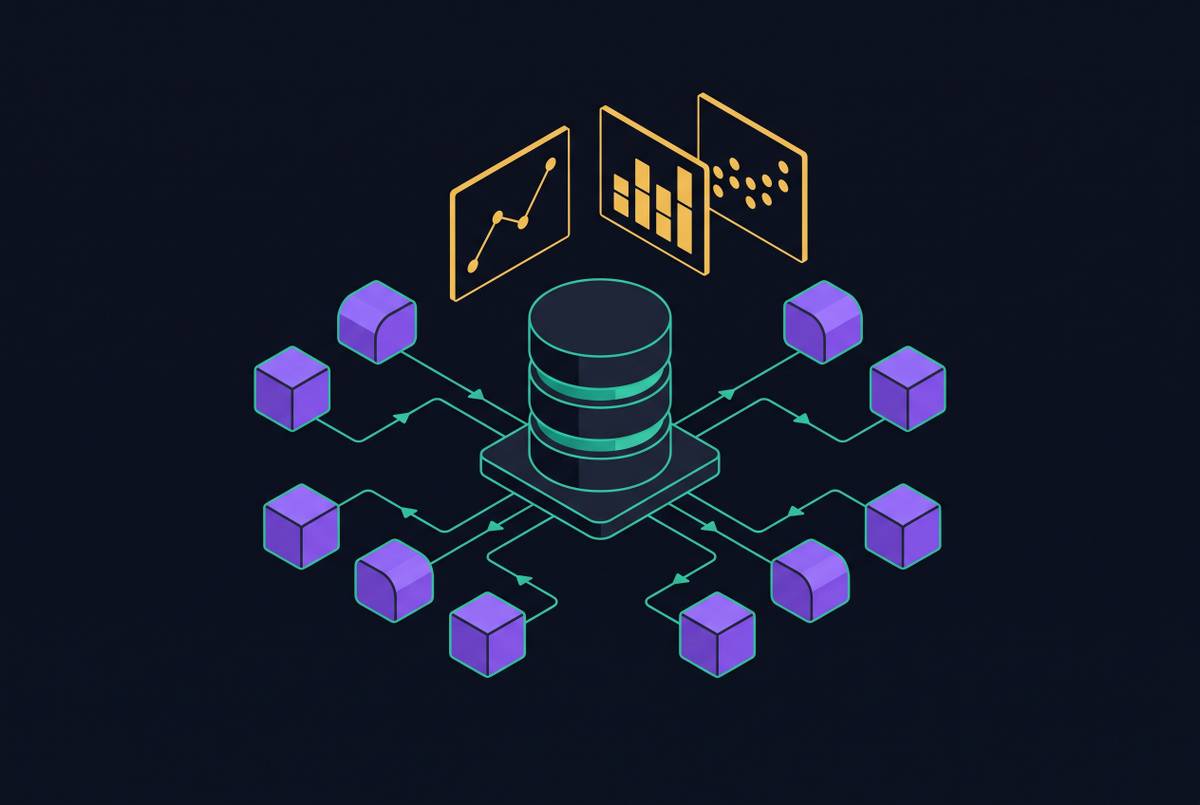
Headless BI separates the semantic and metrics layer from presentation. ThoughtSpot describes it as “a centralized modeling layer and a semantic layer between your data warehouse and the tools that consume data”. Definitions are centralized and exposed through APIs so that different consumers can request the same governed answer. Consistency is the central purpose of that separation. A dashboard remains one possible consumer, but it no longer owns the definition.
Headless analytics separates the analysis engine itself from its interface. Mixpanel describes programmatic access through which developers, applications, scripts, and agents can run analyses, retrieve structured results, and use them elsewhere. The analogy is headless CMS separating content management from display, or headless commerce separating the storefront from the backend. Here, the engine becomes independent of the visual interface. Headless BI, headless analytics, and a semantic layer are therefore complementary rather than interchangeable, with developer teams often needing both a callable engine and governed definitions.
The semantic layer as the piece that makes metric definitions reusable infrastructure
“Active customer” illustrates why access alone is insufficient. Marketing may count someone who opened an email in 90 days, finance someone who purchased in 12 months, and product someone who logged in in 30 days. Each definition can serve a legitimate purpose. The ambiguity appears when all three travel under the same name, leaving consumers to assume that they describe the same population. An API can distribute that ambiguity just as efficiently as a dashboard.
A semantic layer makes the interpretation explicit and reusable. It sits above the data store and defines how data should be understood. A consumer requests a defined metric instead of reconstructing its calculation from tables. This turns agreement into an architectural boundary. The organization still has to decide what “active customer” means, but it can enforce that decision through the shared definition instead of relying on every consumer to reproduce it correctly.
The same boundary provides a place for row-level security and permissioning. The UK team can see UK data, while an agency partner can see campaign performance without seeing margins. Those rules need to apply when a consumer accesses the metric, as well as on the screen that shows it. Schema changes can also be absorbed there. When a column is renamed, the mapping can be fixed once in the semantic layer without changing downstream consumers, as long as the metric's external definition stays the same.
That insulation is what makes the layer infrastructure. Its value is that business meaning, permissions, and consumer access have a common point of control. A dashboard, an application, and an agent can then depend on the same definition without depending on one another's implementation.
How developer teams actually consume analytics — and why the traditional model excludes them
A developer building an eLearning application may need to define “learning”, compare signals across course completions, and account for how many courses each student has taken. That work requires assembling an analysis programmatically. The result must work with the rest of the application's logic. If the analytical engine is accessible only through its visual interface, the developer has to leave that engine behind when building the application.
Mixpanel describes consumption patterns that include scheduled retention or funnel analyses, threshold alerts, automated actions, and analyses combined with CRM or financial data. These workflows need structured results they can use outside the browser. Custom frontends have the same requirement. Headless analytics SDKs can return Pandas DataFrames, allowing developers to combine analytical results with other data in the same programming language in the environment where they already work.
Analytics can also enter the software development loop. A closed ticket can annotate a data dictionary, a filed bug can trigger an agent to locate a regression, and CI/CD pipelines can become data-aware. These integration problems require callable analysis and definitions that remain available outside the BI interface, especially when specialized tools for auth, storage, APIs, edge functions, and queuing each calculate signals differently.
Direct database queries can appear to bypass the constraint. Developers already have code, tables, and a question to answer, so rebuilding the calculation may seem faster than introducing another layer. However, that shortcut also bypasses the shared interpretation and access boundary. Governance, performance, and accuracy become sharper risks when an AI agent, rather than a developer reviewing a query, is the consumer.
Why giving AI agents direct database access is the wrong default for analytics
An agent with table access needs the rule that revenue excludes test orders and refunds to be available in the definitions it uses. Without that context, it must infer the calculation. An answer can look right even when it uses the wrong business rule, so the error is harder to spot than a query that clearly fails.
The recommended default is therefore governed analytical access. Queries should pass through a centralized gateway that enforces permissions and logs access, and should target read replicas. Identity, lineage, cost controls, and auditability also need enforcement at the layer the agent queries. The semantic layer supplies the business context, while the access architecture controls how it is used.
The recommended sequence is “read → decide → act”. Teams should start with read-only resource servers that let them read data without write access, then add write actions with change approvals. An agent can have permission to retrieve a usage metric without permission to change the records behind it.
Anthropic built the Model Context Protocol as an open standard that connects AI systems to external tools and data repositories. MCP separates the client, which is the agent, from the server handling authentication and formatting, and from the resource, which may be a database or API. With governance in place, a server can make only pre-approved metrics and fields available.
There is also a performance trade-off to acknowledge. For high-frequency integrations with sub-100ms response requirements, a direct API call to a well-optimized endpoint will outperform an MCP-mediated equivalent. Both paths can be evaluated against the need for defined metrics, controlled access, and analytical workload separation.
What analytics infrastructure fits a Supabase team that needs raw API access
Supabase said nearly 10 million developers were using its platform as of June 2026. Its scope extends beyond the database to auth, storage, realtime messaging, edge functions, and AI-agent infrastructure. Teams often have to put the analytics layer together themselves. For a team building across those services, raw API access is useful only if it reaches an analytical backend rather than forcing every application to reconstruct metrics from production tables.
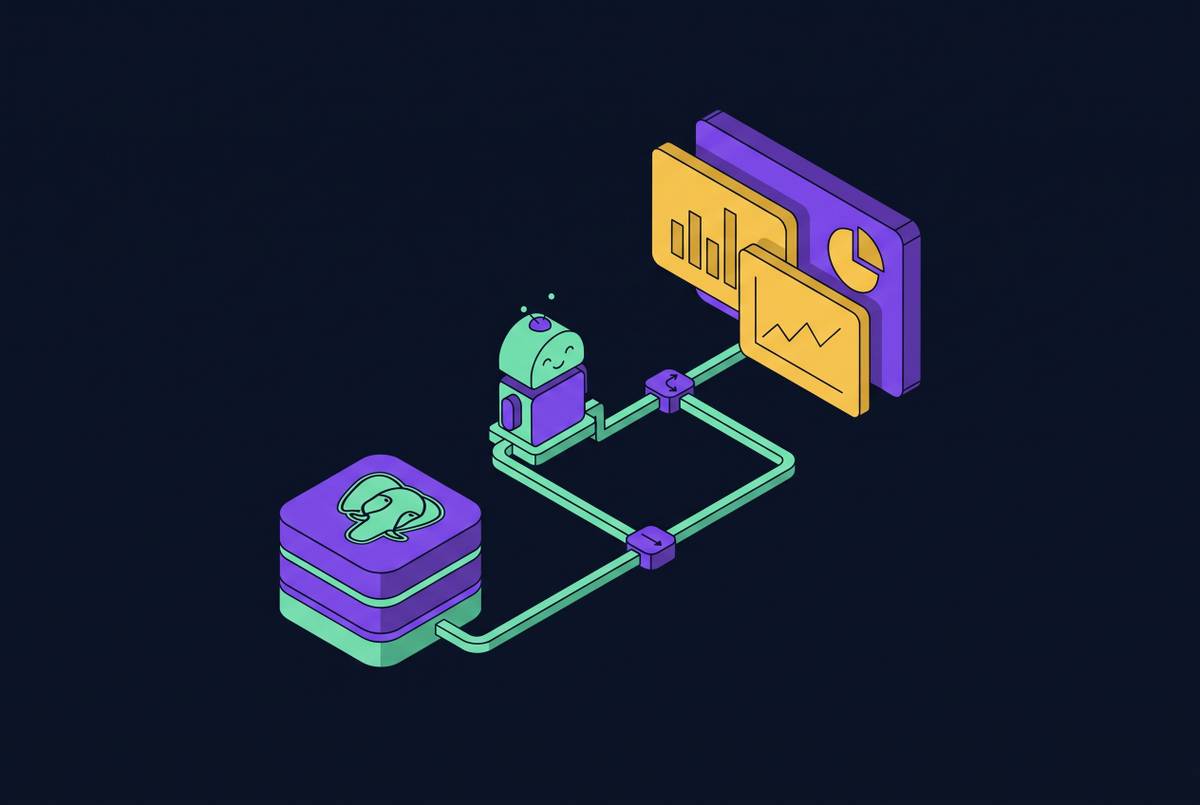
Workload separation is the foundational decision in that backend. Supabase Pipelines, announced in 2025, enables near-real-time streaming of Postgres data to ClickHouse, DuckLake, and other targets so analytical queries can run away from the production database. That path fits teams separating analytical and transactional workloads. For teams that want analytics to remain inside Postgres, pg_duckdb embeds DuckDB's columnar-vectorized engine to accelerate analytical queries without exporting data or managing a separate system. These options address different deployment needs alongside the semantic layer.
Realtime delivery introduces a separate scaling constraint. Postgres Changes filters table inserts, updates, and deletes for each connected client and re-checks RLS for each, so thousands of subscribers on a hot table are known to cause a sharp drop in how well it scales. The recommended pattern is Broadcast for high-frequency ephemeral events and Postgres Changes for durable state. Realtime subscriptions are not an analytical workload strategy. Treating those concerns separately prevents the delivery mechanism from determining where analytical calculations must run.
Above the storage and query choices, pre-modeled, pre-calculated datasets queryable through DuckDB can provide analytical context through an MCP server. Agents then consume those datasets without touching production Postgres. For a team adding usage analytics to an AI agent without a prebuilt dashboard, this is the relevant pattern. The agent gets structured analytical results through a governed interface, and the application can choose how to show them.
Production teams should observe the database, API layer, auth flows, storage usage, Edge Functions, and client-facing errors from day one. Useful alerts include database CPU saturation, storage growth, elevated 5xx responses, slow query spikes, failed login anomalies, Edge Function error rates, and webhook retry storms. Headless access makes analytics callable, while observability helps teams understand whether the systems supporting those calls are healthy.
The metrics discipline that makes headless analytics useful rather than just available
One person, whether a technical founder, data lead, or designated metric owner, must arbitrate what each metric means. Without explicit ownership, competing interpretations can return even when a semantic layer exists. Infrastructure provides a place to enforce agreement. It cannot decide whether the business should count an email open, a purchase, or a login as an indication of an active customer.
The recommended metric set should expand with the business. During validation and pre-PMF, activation, time to value, and cohort retention help show whether users get value and come back for more. Early traction adds MRR components, logo churn, and gross revenue retention. Repeatable growth adds CAC, payback period, the ratio of lifetime value to acquisition cost, NRR, and gross margin, while scale adds cohort and segment retention, channel CAC, burn, and runway. Stage determines scope rather than the platform's capacity to expose more metrics.
The CEO dashboard provides a practical reconciliation test. Every metric on it should trace to a single source, with ARR from the billing system, cash from the bank, and product usage from the analytics layer. When sales, finance, and product maintain separate versions of ARR, executive discussion shifts from decisions to reconciling numbers. Delivery should be deliberate as well. Metrics should be calculated ahead of time and pushed to inboxes, Slack, or phones rather than depend on someone remembering to check, and a headless architecture with an MCP layer makes that pattern automatable.
For early teams, establishing this discipline is also a staffing decision. An analytics engineer can make existing data usable, but the salary commitment comes before benefits and tooling, so a governed data layer through a partner is often the faster and cheaper path. The tool choice cannot be separated from ownership. Someone must keep definitions trustworthy as more applications and agents begin to depend on them.