Modeling Analytics as Postgres Infrastructure Instead of a Reporting Product on Supabase
Governed datasets and MCP keep agents off production Postgres.
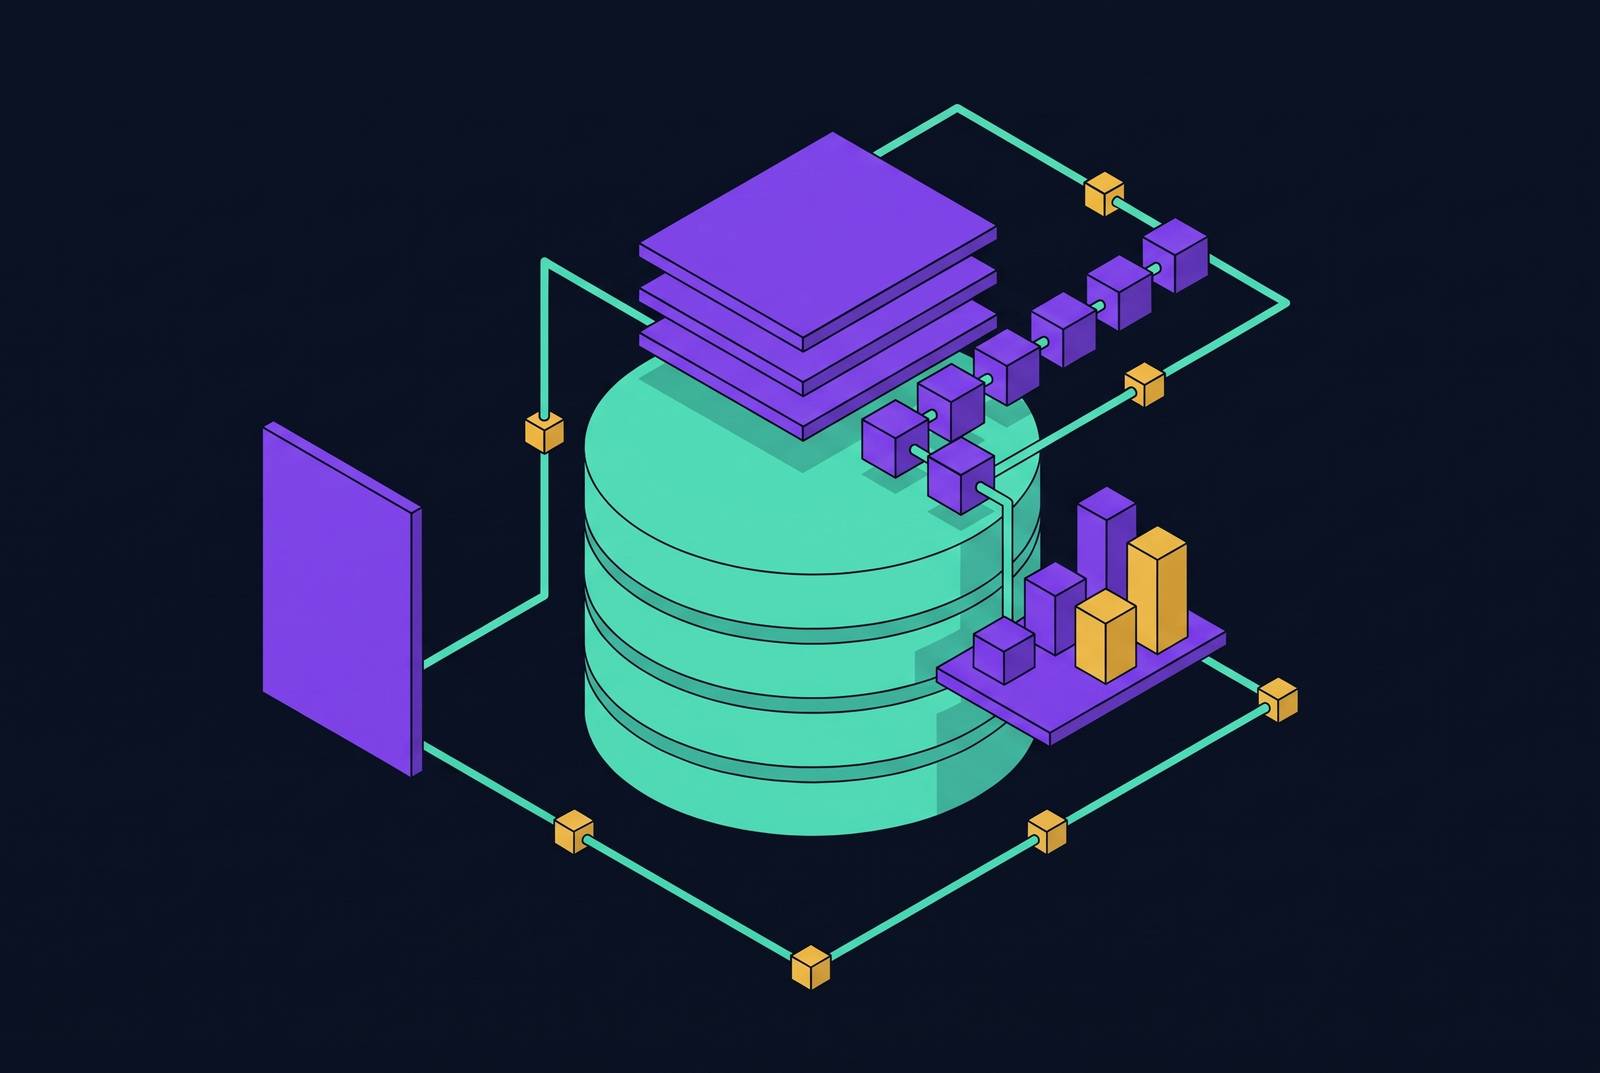
For API-first and agent-first teams on Supabase, the strongest analytics backend is a governed, headless data layer. Pre-modeled datasets, shared metric definitions, and permissioned API or MCP access make the same numbers available to applications, dashboards, and agents without an opinionated frontend. This architecture keeps analytical load apart from production traffic and puts the business meaning of the data beneath every query surface.
Why the reporting-product model breaks on Supabase at scale
A key field buried in a JSONB column can become five different metrics when five people write their own extraction queries. Each fragment may look right on its own but give leadership a slightly different number. A reporting tool can show those results neatly without settling which extraction rule fits the business.
The same direct connection creates two operational risks. Analytical queries from reporting tools and ungoverned agents share a connection pool with live user traffic. On lower Supabase tiers with hard connection limits, one misbehaving agent can exhaust that pool across tenants. Postgres is row-oriented and tuned for transactional work, so analytical scans across large row sets compete with application requests for CPU and memory.
Supabase recommends read replicas for complex analytical queries while reserving the primary for user-facing operations. That addresses workload placement, but not conflicting definitions. Connection exhaustion, compute contention, and metric drift have different causes and different blast radii. Treating all three as problems with the reporting interface leaves the architecture beneath it as it was.
What "analytics as infrastructure" actually means in this context
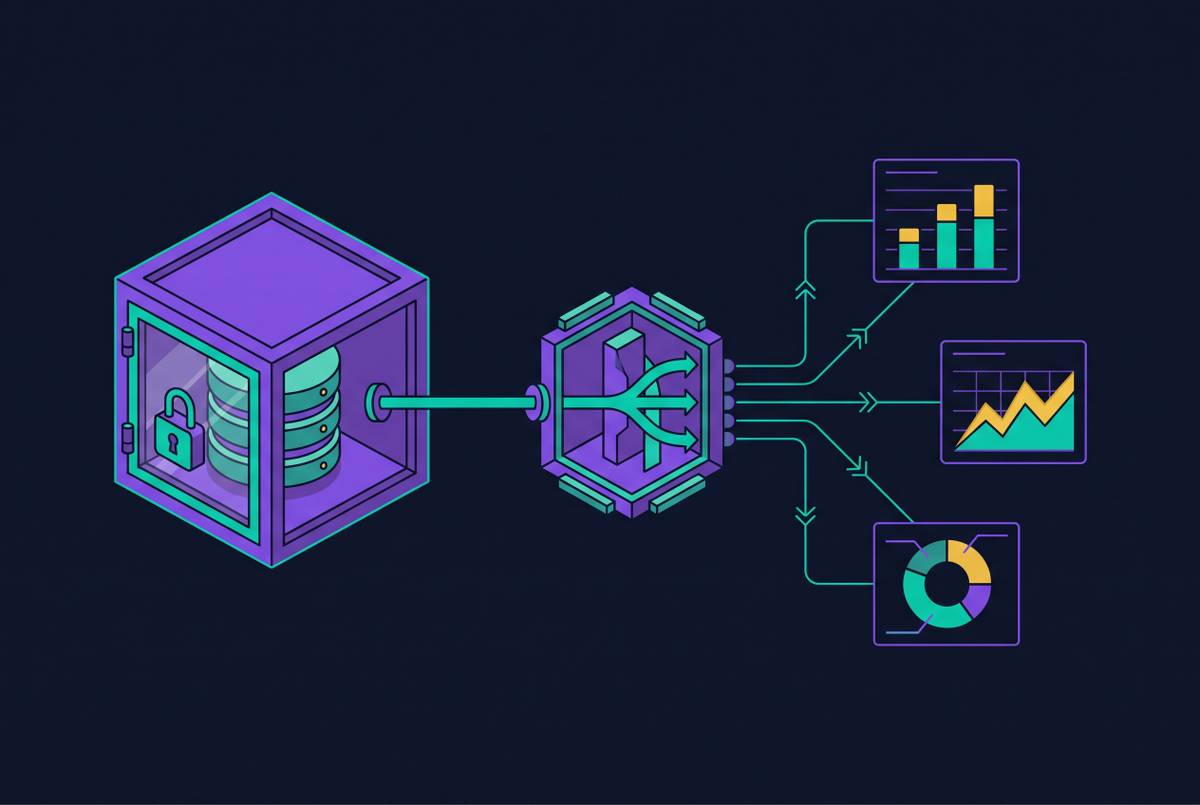
With analytics as infrastructure, governed, permissioned, refreshable datasets live beside the production database, so analytical calculations take place outside it. Metrics are calculated ahead of time and stored for access through a standard interface. The architecture has four distinct layers of responsibility. Their purpose is to separate trusted data and business rules from the interfaces that present answers.
The Data Substrate contains verified, permissioned, refreshable data with documented provenance. Above it, the Reasoning Layer contains semantic schemas, metric definitions, and business rules declared once and versioned. This is where revenue excludes refunds, cancelled orders, and soft-deleted rows. The Delivery Layer makes that governed information reachable, historically through a dashboard portal and increasingly through an MCP endpoint. The Decision Layer is where an answer becomes a Slack message, an inbox report, or an agent recommendation owned by a person with an outcome to drive.
A fast, read-oriented engine such as DuckDB over Parquet can serve the pre-calculated datasets without querying raw production tables on demand. The frontend is no longer the defining component. As headless commerce separated the storefront from the commerce engine, headless analytics separates presentation from governed analytical logic. A different interface can consume the data without introducing a different definition of revenue.
Why pre-modeled datasets must sit beneath any query surface, not raw tables
A BI tool, an agent, or an MCP server cannot supply business meaning that the underlying data lacks. Without semantic governance, an LLM selects the statistically likely field. A column named rev_net_adj may look like revenue even when it includes an intercompany adjustment that finance takes out every month. The resulting answer can appear authoritative. The error may remain hidden until it reaches a board deck or an agent acts on it.
Each metric has a named owner, a versioned definition, and a contract the agent can retrieve before querying. A semantic document makes approved field meanings and business logic available with the schema, so the agent can resolve a request against an explicit definition. The governed datasets then run against a read-oriented engine.
A read replica separates analytical compute from the primary while allowing five analysts to write five incompatible revenue queries against it. Identity state belongs with identity providers, semantic state in metric catalogs, and audit state in external logs. The MCP server wires safe access to these systems.
How MCP becomes the governed delivery layer for Postgres analytics
MCP gives applications and agents a common protocol for reaching the governed layer. Instead of N×M application-to-source connectors, the architecture uses N+M implementations of a common protocol. One server can serve Claude, ChatGPT, Cursor, and other MCP-compatible clients without a bespoke connection for every pairing.
The protocol offers three primitives with distinct analytical uses. Tools run queries, Resources supply governed schemas and datasets as context, and Prompts provide reusable templates for repeatable workflows. Anthropic introduced MCP in November 2024 and donated it to the Agentic AI Foundation under the Linux Foundation in December 2025. By early 2026, the ecosystem had grown past 10,000 servers, making the protocol a shared integration surface.
The July 28, 2026 specification made MCP stateless at the protocol layer. Each request carries its protocol version, client identity, and capabilities, so it can go to any server instance behind a plain load balancer without session affinity. State belongs outside the protocol server between calls. This reinforces the separation between access delivery, identity, semantic definitions, and audit history.
For Supabase teams, tooling such as FastMCP supports custom servers that make business rules and tribal knowledge available beyond what schema introspection reveals. Those servers can make the approved revenue calculation available so consumers do not have to work out the refund and cancellation rules themselves. But scaling the MCP server leaves the database with the same capacity. An agent reaching production Postgres through MCP can still exhaust its connection pool.
Safe agent-to-data access patterns for Supabase projects
Production-safe agent access begins with structural separation at the data layer. Every agent should reach data through the same access-controlled interface, without a connector and embedded credentials of its own. The access boundary must be in place before queries start. This makes the governed interface the common route to data, rather than an optional route that some consumers can bypass.
The query surface should be read-only and backed by pre-modeled datasets. Agents can query Parquet files through DuckDB or use a governed analytical copy, but the production write path should not be reachable from the MCP surface at all. Even when writes are restricted, expensive reads can still compete with live traffic.
Supabase reports that more than 70% of new databases are now created by agents or AI-driven tools. That makes agent access part of the architecture teams need to plan for. Inspectability must therefore accompany the access boundary from the outset. Under the stateless specification, every tool call should emit a structured log to an external observability system, creating an audit trail that remains available after the request ends.
Observability signals that distinguish analytical load from transactional load in Supabase
Audit logs show what agents do, while database signals show what that work costs the database. A team that cannot distinguish analytical from transactional load cannot judge when the two need separate infrastructure. Query-level signals reveal which statements are slow, why they are slow, and how often they run. This is where analytical scans masquerading as ordinary application queries become visible. A general database-health indicator cannot provide that distinction.
Connection-level signals show how many connections are open, what they are doing, and who is waiting. If clients fall back to direct connections when PgBouncer is down, they can exhaust the connection budget within minutes. System-level signals complete the picture through CPU, memory, IO, disk, and replication lag. Together, these signals reveal whether analytical work is competing with live requests for the same resources.
Supabase’s Metrics API exposes Postgres performance and health metrics in Prometheus exposition format. The raw signals are already available to teams. Dashboards and alert rules must turn them into useful operational distinctions before the first incident. PostgreSQL downtime means everything fails, Auth downtime prevents new logins, and PgBouncer downtime creates a connection-exhaustion risk. Those different failure scopes require distinct alerts.
Why metric consistency becomes a structural problem as teams and agents scale
The business consequence appears in the founder’s weekly review. ARR comes from the billing system, cash from the bank, and product usage from the analytics warehouse. When sales, finance, and product also maintain separate versions of ARR, the meeting turns into an argument about definitions. This is the organizational counterpart of fragmented query logic. Each surface has become another place where business meaning can diverge.
The stakes change as the company grows. At seed, investors focus on MRR/ARR, CAC, LTV, churn, and burn multiple. At Series A, NRR, gross margin, and payback period take priority, while Series B and beyond bring contribution margin, cohorts, and leverage to the foreground. None of these definitions belongs in personal SQL fragments. Board reporting needs a governed contract regardless of which metric currently dominates the discussion.
Agents amplify the cost of leaving those contracts implicit. They run far more queries than human analysts and cannot draw on what people in the company know to spot a misleading number. Agents’ queries expose gaps in naming and permissions, along with definitions that disagree, faster than the team can fix them. Declaring metrics once, versioning them, and serving them through the same layer to agents, dashboards, and APIs makes consistency a property of the architecture.
How founders access this infrastructure layer without building a data team
For a Supabase founder, the organizational objection is substantial. Pre-modeled datasets, semantic contracts, and an MCP-accessible interface sound like a data engineering project, yet many founders do not have a data engineer. Separating the frontend from the backend does not remove the work required to maintain that backend. Deciding who will maintain the backend therefore comes before choosing the interface.
An analytics infrastructure provider can maintain the governed layer while the founder owns the data contract. Working with a partner this way gives the founder governed metrics, a semantic layer, and MCP-accessible data without having to hire a data engineer or own a reporting product. The division resembles Supabase’s own abstraction of database administration. The provider maintains the infrastructure, while the founder consumes numbers defined by the agreed contract.
Supabase for Platforms has been the fastest-growing product over the last year, and much of Supabase’s growth is attributed to partners building on it. That trajectory illustrates how infrastructure abstractions support an ecosystem of specialized providers. For API-first buyers, the relevant criteria are governed definitions, permissioned access, analytical isolation, and independence from a mandatory frontend. Usage analytics can then reach an agent through the same governed datasets available to other consumers, without requiring a prebuilt dashboard UI.
What the infrastructure approach requires the team to accept, and where it genuinely adds complexity
The infrastructure approach replaces one reporting tool’s internal conventions with explicit contracts between layers. Those contracts need care after they are first set up. Metric definitions must be declared and versioned, which brings into view work that a reporting tool can hide inside its interface. The analytical copy also needs a refresh cadence, provenance tracking, and failure alerting. Querying production directly avoids the work of managing that copy, but brings the risks described earlier.
The MCP surface must enforce what the data layer defines. A server that exposes raw tables beside governed datasets creates an escape route from the semantic contract. When a semantic tool returns nothing, an agent can reach for raw SQL and defeat the governance model. Delivery therefore cannot be designed independently of the governed substrate.
For the earliest-stage team with one agreed metric and no agent consumers, a simple dashboard tool may be the better choice. The infrastructure approach earns its cost when metric drift becomes a weekly argument or agents enter the loop. Its advantage is the placement of complexity in a shared layer with explicit ownership. That requires maintenance, but avoids recreating the same business logic in every reporting surface, resolving the same disagreements in every meeting, and discovering dependence on a reporting tool only when migration becomes necessary.