Tracking AI Agent Usage Directly in Postgres With Aggregated Views and No Front End
Aggregated Postgres views let teams track agent usage without building separate infrastructure.
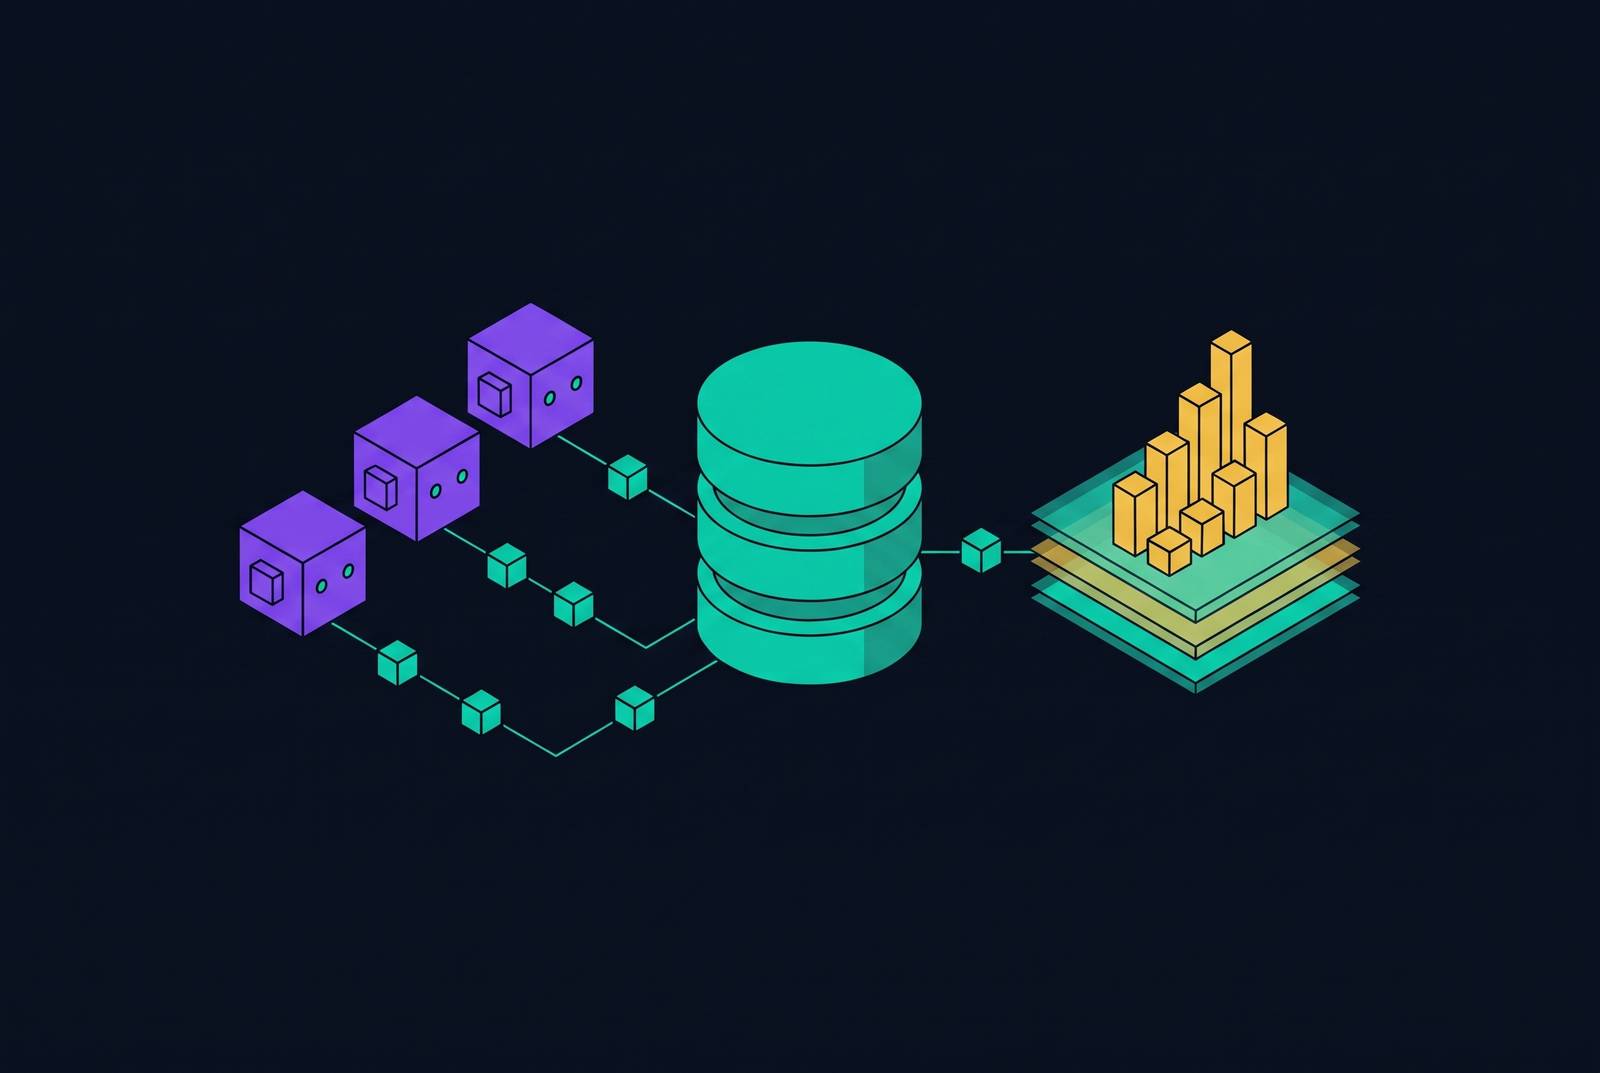
For API-first and agent-first teams whose agents already write activity to Postgres, aggregated views provide a headless analytics backend without a prebuilt dashboard UI. “Tracking AI Agent Usage Directly in Postgres With Aggregated Views and No Front End” explains how database-side aggregation, scoped access, and scheduled alerts expose usage, errors, and token costs. This approach works until analytical work needs to run apart from production traffic.
Why AI agents make Postgres the right place to track agent behavior
Datadog's State of Postgres found that a majority of organizations run Postgres in production, with cloud deployments growing fastest. For AI-native products built on that infrastructure, agents introduce another kind of database user. They run queries, write state, log tool calls, and append traces against the same primary that serves the application. Their activity is already part of the operational record. Observability can therefore start with data the product already stores, with no need for a new collection system.
Customers, subscriptions, payments, and audit trails can sit in the same database as the records of what an agent did. A usage query can distinguish agents, models, and tenants without requiring a separate system to reconstruct those relationships. When the necessary events exist in Postgres, aggregated views can answer what an agent is doing, how often it runs, and what it costs.
The workload mismatch that makes naive observability dangerous
A single agent run creates two different workloads. State changes and tool-call records need fast transactional writes, but usage analysis has to scan thousands or millions of runs. ClickHouse's engineering guidance describes the collision between predictable p99 latency on the agent path and heavier telemetry aggregation. Both workloads consume CPU, I/O, and buffer cache on the same primary. A query that helps explain agent behavior can therefore compete with the operations that keep the agent responsive.
Transaction handling can compound that competition. The Datadog report found that Postgres backends spend a majority of their time idle in transaction. Client-side logic that holds transactions open adds another source of pressure when slow analytical queries share the database with live traffic. Moving raw rows into application code preserves that pressure and leaves the application responsible for processing the data it retrieves.
A dedicated OLAP engine or third-party APM tool offers a separate place to do the work, but adds infrastructure, cost, and another place where numbers can diverge. Separation can become necessary as workloads grow. Before that point, changing the shape and timing of observability queries can reduce repeated work without abandoning Postgres. Aggregated views provide that boundary, although regular views alone do not isolate compute.
What to log and how to structure the agent activity tables
To build useful views, teams should first write agent activity into structured, append-only tables. The minimum record includes a run ID, agent identity or role, model name, tool called, prompt tokens, completion tokens, latency in milliseconds, error code or null, tenant ID, and a UTC timestamp. Prompt and completion tokens need their own columns because both go into cost calculations. The run ID connects individual actions to the run they belong to.
The row should represent one agent action. Token usage, tool-call outcomes, and error codes belong together so every observability query can read them without having to join three tables. An outcome field supports the distinction between success, error, and timeout in the tool-call view. Agent runs should append rows instead of updating the same activity records over and over. These inserts cut down on contention from updates and avoid extra vacuum work.
UTC timestamps keep day buckets unambiguous when agents run across regions, while local-time records can make those boundaries unclear. Correctness begins before the aggregation runs. A wrong or stale event produces a wrong aggregate even when the SQL is sound. Establishing the event shape at the start gives the views a dependable input without turning the logging schema into a separate analytics project.
Aggregating at the database layer rather than the application layer
At first, the OpenTag project read 30-day agent usage by returning one row for each accepted delivery, then aggregated those rows in Node.js. After grouping moved into PostgreSQL with UTC day buckets, the usage query dropped from 121ms to 93ms with far smaller payloads. The application received the grouped result to answer a usage question.
The general pattern groups by date_trunc('day', created_at AT TIME ZONE 'UTC'), agent role, and model name, then sums prompt tokens, completion tokens, and error counts. To work out costs, the same view can multiply token counts by the rates for each model. That keeps the arithmetic in one place. An agent, an API consumer, and a human SQL client can then receive figures based on the same definition, rather than maintaining separate implementations of token-cost logic.
A regular view still recomputes its result on every query. For frequently read metrics that do not need immediate freshness, a materialized view stores the aggregate and moves its computation off the read path. A pg_cron job can refresh it on a schedule. The Datadog report identifies pg_cron as the most widely deployed non-bundled Postgres extension in production. Hourly refresh is a reasonable default for most token-cost and error-rate views, with faster refresh trading more compute for fresher results.
Scheduled aggregation still consumes database resources, so its execution needs measurement. Teams should use pg_stat_statements to check mean and total execution time and call counts. Availability does not mean it is enabled. Managed instances may require a parameter-group change and CREATE EXTENSION in each database. Those measurements show whether the views themselves are becoming a bottleneck rather than assuming that moving work into SQL has made it cheap.
How do you add agent usage analytics without a dashboard UI? Start with four views
Daily token spend by model answers which model drove the cost. Its SQL structure groups by UTC day and model name, sums prompt and completion tokens separately, and multiplies those totals by configurable rate columns. The grouping can also retain agent role when the question concerns a particular agent. Because the rate calculation lives in the view, consumers do not need to reproduce it.
The view for tool-call success and failure rates groups activity by tool name and by outcome: success, error, and timeout. Counts in those buckets expose which tools fail and how frequently. Error distribution by agent role provides a different diagnostic cut. It groups by role and error code, ordered by frequency, to show whether failures cluster in one agent type or spread across several. The two views separate tool reliability from the distribution of agent errors.
Per-tenant usage groups by tenant ID and UTC day, aggregating token counts and run counts. Teams can use that to bill for usage and spot tenants whose usage is growing faster than expected. All four views belong in a dedicated analytics schema, with a read-only role granted read access only to those views. They can begin as regular views and become materialized views when read volume justifies scheduled refresh. The aggregation logic stays the same, while the creation statement and refresh job change how its result is maintained.
Keeping agent queries away from production tables with roles and row-level security
To make these views an access boundary, teams should create one dedicated read-only Postgres role per agent type and avoid shared service accounts. Each role should receive SELECT only on the permitted views in the analytics schema. The view's column list sets which fields a role can see. A customer_health-style view, for example, can include account ID, plan tier, usage trend, and renewal date while excluding payment tokens, password hashes, and unnecessary personal data.
Column selection does not establish tenant isolation. Multi-tenant products also need row-level security on the base tables, with policies that restrict access to the current tenant. Tenant context requires particular care with pooled connections. current_setting('app.tenant_id', true) returns NULL when the setting has never been supplied, allowing a tenant comparison to filter every row and prevent exposure of unscoped data. Wrapping it in NULLIF(current_setting('app.tenant_id', true), '') also handles an empty string left behind after a transaction ends.
Teams should force RLS on tables agents can touch rather than merely enable it, while keeping the agent's access confined to its dedicated role. Auditability is a separate requirement from isolation. Using pgaudit to log the queries those roles run gives teams a record they can check for governance and compliance. Aggregation controls what a query returns and how much processing it needs. Roles, tenant policies, and query auditing address who can ask the question and what access they exercised.
Alerting without a dashboard: pushing metric thresholds to where the team works
To avoid depending on someone opening a dashboard, teams should evaluate thresholds in Postgres and push alerts to Slack, email, or a webhook. The refresh schedule provides the natural trigger. One pg_cron job refreshes the materialized aggregate, and the next runs a threshold-check function against the updated result. A breached limit can call pg_notify or an http_post to a webhook. Refresh and alert evaluation thus form one sequence rather than two disconnected monitoring systems.
Useful thresholds can flag when daily token spend goes above a cost limit per model, when a tool's error rate goes above a set percentage in the last hour, or when a tenant goes over its usage quota. Connection count can also be checked against a safe fraction of max_connections. The evaluation window must match the time the stored aggregate covers and how fresh the data is. An hourly error-rate check, for example, needs a last-hour aggregate.
The Datadog report identifies missing statement_timeout, idle_in_transaction_session_timeout, and idle_session_timeout safeguards as a primary stability risk. Connection alerts complement those safeguards. For usage and error metrics, the same view queried by a human in psql can supply the scheduled threshold check. That leaves one definition serving both investigation and notification. The headless analytics principle is to push a signal where the team works.
When Postgres-native aggregation is enough and when a governed data layer adds more
Postgres-native views are a strong starting point when runs number in the thousands rather than millions, one person can maintain the definitions, and a few minutes of freshness lag is acceptable. For API-first teams, the main selection criteria are control over metric definitions, access independent of a frontend, tenant isolation, and workload impact. No dashboard is required to satisfy those criteria. The SQL layer supplies the shared definitions, while each consumer chooses how to use the results.
ClickHouse's guidance recommends isolation when analytical scans push transactions beyond their latency target, reporting misses its own SLA, long analytical transactions interfere with vacuum, or Postgres is overprovisioned mainly for aggregations. These are operational signals. A view can remain logically useful even when running it on the primary is no longer appropriate. At that point, the location of the work must change.
Supabase recommends read replicas as one option when analytical queries hurt production, together with Pipelines and Analytics Buckets. A replica takes the work of running analytical queries off the primary and has its own bill. Replicas inherit the primary's compute size by default but can be sized smaller for analytics workloads. At the same tier, the extra instance can roughly double what the team spends on the database. For a Supabase team that needs raw access rather than a prescribed frontend, that makes workload isolation and cost explicit selection criteria.
A governed analytical copy is the next step when broader separation is needed. Pre-modeled datasets in a format such as Parquet, queryable through DuckDB, let agents and human tools analyze data without touching the production primary. The earlier view definitions still have a purpose. They become the specification for the governed layer's datasets, with the SQL aggregation logic moving into that layer. The boundary changes, but the team retains control of its metrics and remains independent of any particular frontend.