Separating Read Workloads From Transactional Postgres Without a Warehouse
Use read replicas and materialized views to protect transactional performance.
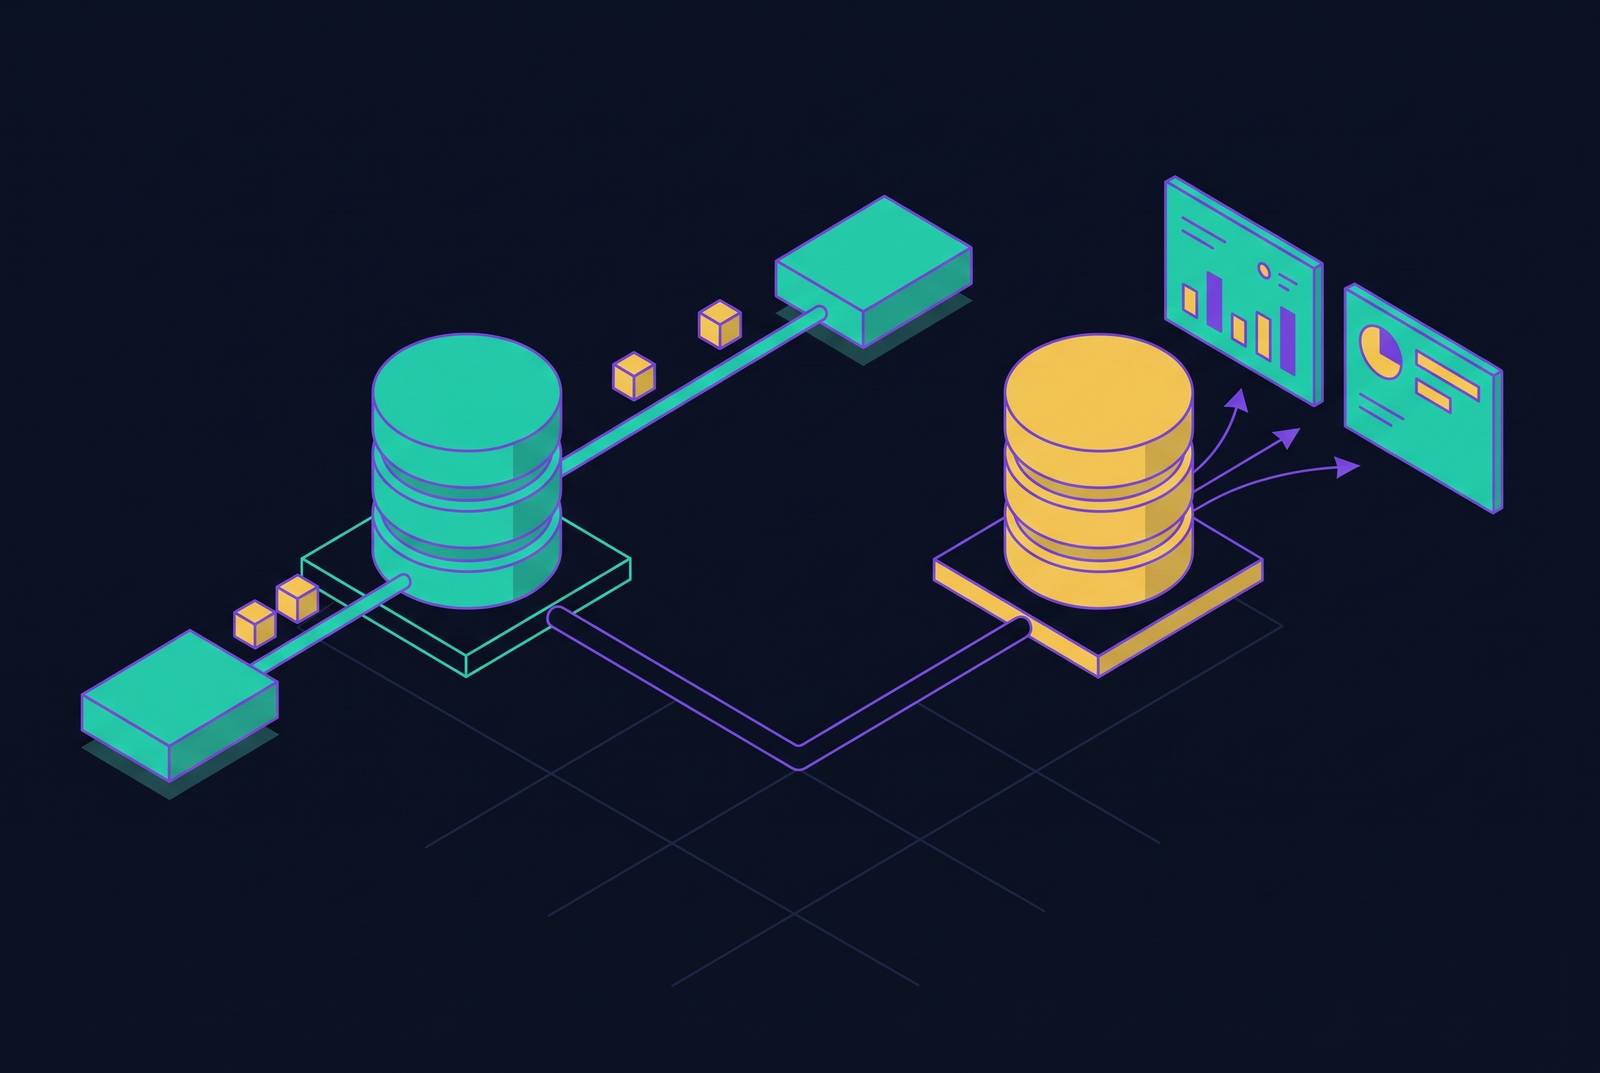
Separating read workloads from transactional Postgres is about protecting user-facing transactions from analytical scans. Once those workloads collide, they need separate resources or pre-computed results. Tuning, read replicas, and materialized views can keep Postgres as the analytical home, while governed datasets provide a shared definition of metrics when humans and agents need the same answers.
Why a single Postgres instance breaks under mixed workloads
A long-running dashboard query slows checkout because both requests compete for the same CPU, memory, and I/O. Postgres is row-oriented and suited to fast lookups, inserts, and updates. Analytical queries instead scan and aggregate across large swaths of rows, consuming resources that transactions also need. Reporting or agent-driven queries can cause resource contention on modest hardware as soon as they join user-facing traffic.
MVCC adds another source of contention. Every UPDATE copies the full row, dead tuples accumulate, and autovacuum competes with live queries for CPU and I/O. Concurrent writes and analytical scans therefore create pressure beyond the cost of the dashboard query alone. OpenAI’s Postgres scaling account describes how that pressure can cascade through a service when an upstream event raises load, latency increases, timeouts trigger retries, and those retries amplify the original spike.
How Postgres internally signals whether a workload is read-heavy or write-heavy
Before choosing how to split the workloads, find out which resource is under pressure. Counting read and write requests alone is insufficient because their costs are not symmetric. Reads pull whole 8 KB blocks but often find them in shared buffers or the OS page cache. Writes have to record WAL entries and may also copy full data pages, update indexes, and touch toast tables. Even fewer writes can therefore mean a lot of work.
OLTP should have a very high cache hit ratio, while a much lower ratio suggests the cache is too small. Sustained I/O wait above 20% at peak is a signal of storage pressure. A p99 more than 5× the p50 is a warning of expensive outliers.
Table-level estimates of read pages and write-affected pages from pg_class can further reveal where the work concentrates. Those estimates distinguish a broadly read-heavy workload from a few reporting tables that dominate resource use. Applications like social media tend to do more reads, while IoT loggers tend to do more writes. Most SaaS products are mixed, so their workload character must come from measurements.
Vertical tuning as the first line of defense before any architectural split
Start with configuration tuning rather than treating it as cleanup after an architectural change. Undersized buffers, disk-spilling analytical queries, and accumulated dead tuples can create symptoms that resemble a capacity ceiling. Correcting those conditions can resolve the immediate collision and delay a split by months. The first task is to make the existing instance use its resources well.
The main configuration levers are shared_buffers, work_mem, and effective_cache_size. Set shared_buffers to 25% of total RAM so Postgres’s internal buffer cache has enough room to cut down on disk reads. For analytical queries, work_mem of 256 MB–1 GB gives sorts and hash joins more memory before they spill to disk. Set effective_cache_size to a large fraction of total RAM so the planner accounts for data likely held in the OS page cache. This setting is a planning estimate.
Autovacuum and indexing address the work those memory settings cannot remove. Lowering autovacuum_vacuum_scale_factor well below its default triggers VACUUM after a smaller fraction of rows changes, limiting dead tuple accumulation. Partial indexes on frequently filtered columns can also reduce the cost of scan-heavy requests. But workloads still share the same CPU after tuning. When p95 latency on user-facing paths rises even with healthy cache hit ratios, it is time for read offloading.
Read replicas as the primary mechanism for offloading scan-heavy queries
Writes stay on the primary, while reporting and scan-heavy queries run against an asynchronous copy. This removes their query-time CPU and I/O demand from the transactional instance without changing schemas. Postgres remains the analytical home, but the primary no longer has to perform every kind of work.
OpenAI’s Postgres scaling account describes a single-primary architecture supporting 800 million ChatGPT users with nearly 50 read replicas across multiple regions. Its principle was to offload all possible read traffic and make the work remaining on the primary efficient. The account says replication lag was kept near zero. That example establishes the scale the pattern can support with disciplined routing.
Analytical replicas also need configuration suited to longer queries. Raising max_standby_streaming_delay above its default lets those queries run longer before they are canceled, but adds more replication lag when query load is high. Independently sized replicas allow analytical capacity to differ from transactional capacity rather than forcing the primary to be over-provisioned. At the application layer, separate connection pools configured through environment variables make the destination easier to change. Code can choose the pool for its workload without being tied to a particular replica.
Where replica-based splits break down and what routing complexity actually looks like
Moving a query to another instance does not make routing automatic. PgBouncer manages connections, while splitting reads from writes requires tools such as PgPool or custom application logic, and balancing traffic across replicas may add HAProxy. Each component exists to make the workload boundary work in practice.
Capacity also carries a direct cost. Where a managed platform provisions the replica at the same compute size as the primary and bills it separately, a same-tier replica roughly doubles database spend. Adding capacity is not an immediate response to a spike, either. Provisioning typically involves creating a snapshot, restoring it, and waiting for replication to catch up. The split must therefore account for provisioning time as well as steady-state demand.
Once replicas are running, health monitoring, lag alerting, failover testing, and configuration drift become permanent responsibilities. Asynchronous replication also means that isolating a query’s cost does not guarantee it reads the primary’s latest state. These costs define the operating burden of replicas. When maintaining replica infrastructure takes more engineering time than the contention it replaced, the next question is whether repeated queries need to run at all.
Materialized views and pre-computed aggregates as the complement to replica routing
Materialized views reduce repeated work. They physically store a query’s result in Postgres, allowing dashboards to read a pre-built result set. A cron-triggered REFRESH MATERIALIZED VIEW recalculates that result on a schedule. The expensive aggregation happens at a chosen moment rather than being repeated across dashboard requests. This makes pre-computation a complement to read offloading.
Faster refresh cycles produce newer aggregates but consume more compute, while slower cycles widen the gap between reported values and the primary. Teams must decide how stale each metric can be. Materialized views fit repeated expensive queries whose consumers can accept scheduled results, keeping the analytical result in Postgres and eliminating the need for a separate warehouse.
Someone must define each view, set a schedule for its refresh, and check that the job runs. As the number of metrics grows, unclear ownership and inconsistent refresh rates can become harder to manage than individual query costs. More importantly, the stored calculation can drift from what stakeholders believe it represents. At that point, performance is no longer the only problem to solve.
Why pre-modeled, governed datasets solve the definition problem that replicas and views leave open
A growth metric calculated from a view refreshed at midnight can differ from the same metric calculated live on the primary at 9 AM. Both can be technically correct reads of the underlying data. Replica routing and materialization do not, by themselves, establish which answer is authoritative.
For shared metrics, the useful unit of analytics is therefore a pre-modeled, pre-calculated dataset with a single definition. Every dashboard, report, and AI agent receives the same number for “active users” from the same source. This turns a collection of independently executed queries into a shared data contract. The contract addresses what a metric means as well as which result consumers receive.
A governed data layer implements that boundary by calculating metrics once and storing them as governed Parquet datasets queryable via DuckDB. A single interface serves those results to human and agent consumers without touching the production database at query time. This serving layer extends the original isolation goal from protecting transactional resources to controlling the answers derived from them.
Safe data access for AI agents running against the same Postgres-backed metrics
An agent has no inherent awareness of query cost and can issue sequential scans or expensive joins against production data. Because it operates at machine speed, a misconfigured request can become a load event before anyone intervenes. Granting write access expands that exposure beyond read contention. A replica alone leaves credentials unrestricted and puts no limits on which data the agent can reach.
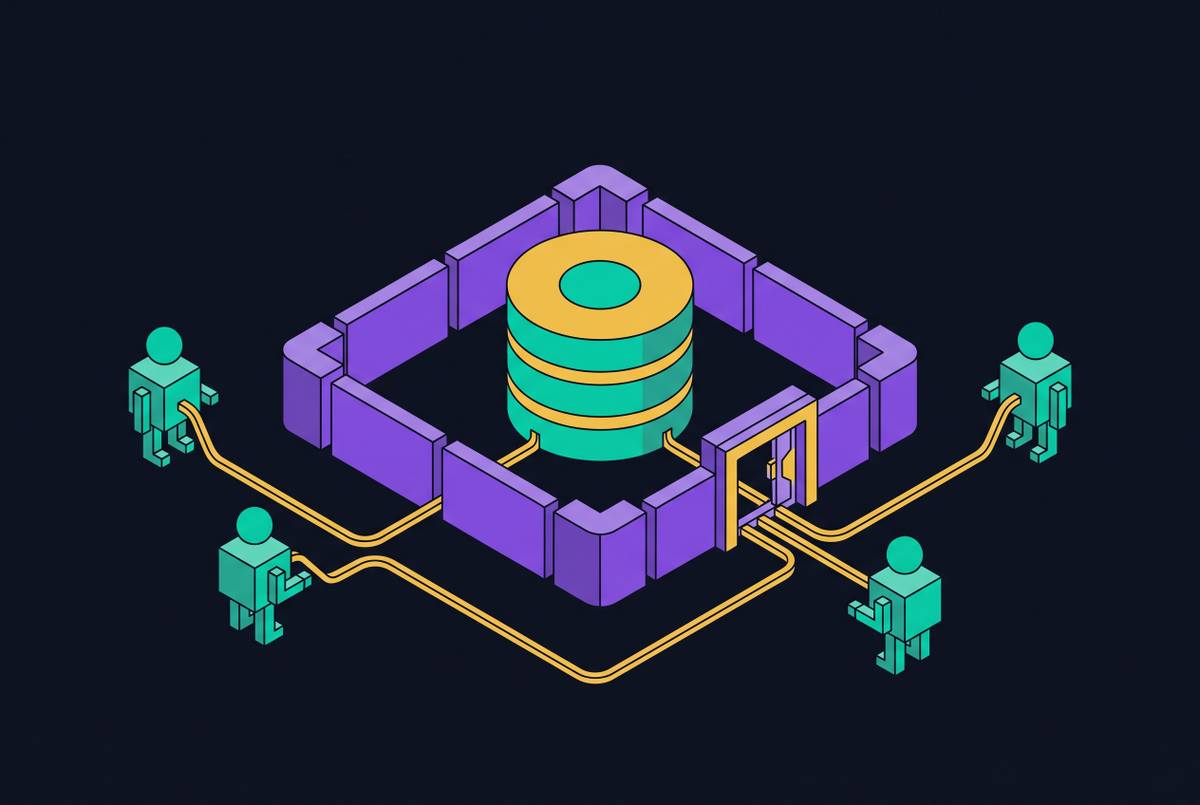
The safe pattern is to keep production database credentials away from agents. All agent data access should pass through a centralized layer that enforces permissions, logs every access, and serves pre-computed data. That boundary protects the primary from the agent’s query choices.
The same boundary also aligns agent answers with human reporting. When both consume the same governed datasets, they use the same metric definitions and calculated results. Least privilege is structural in this design. Within that access path, the agent cannot reach data beyond what the governed dataset and its permissions expose, regardless of how it is prompted.
Choosing the right pattern for your current scale and workload mix
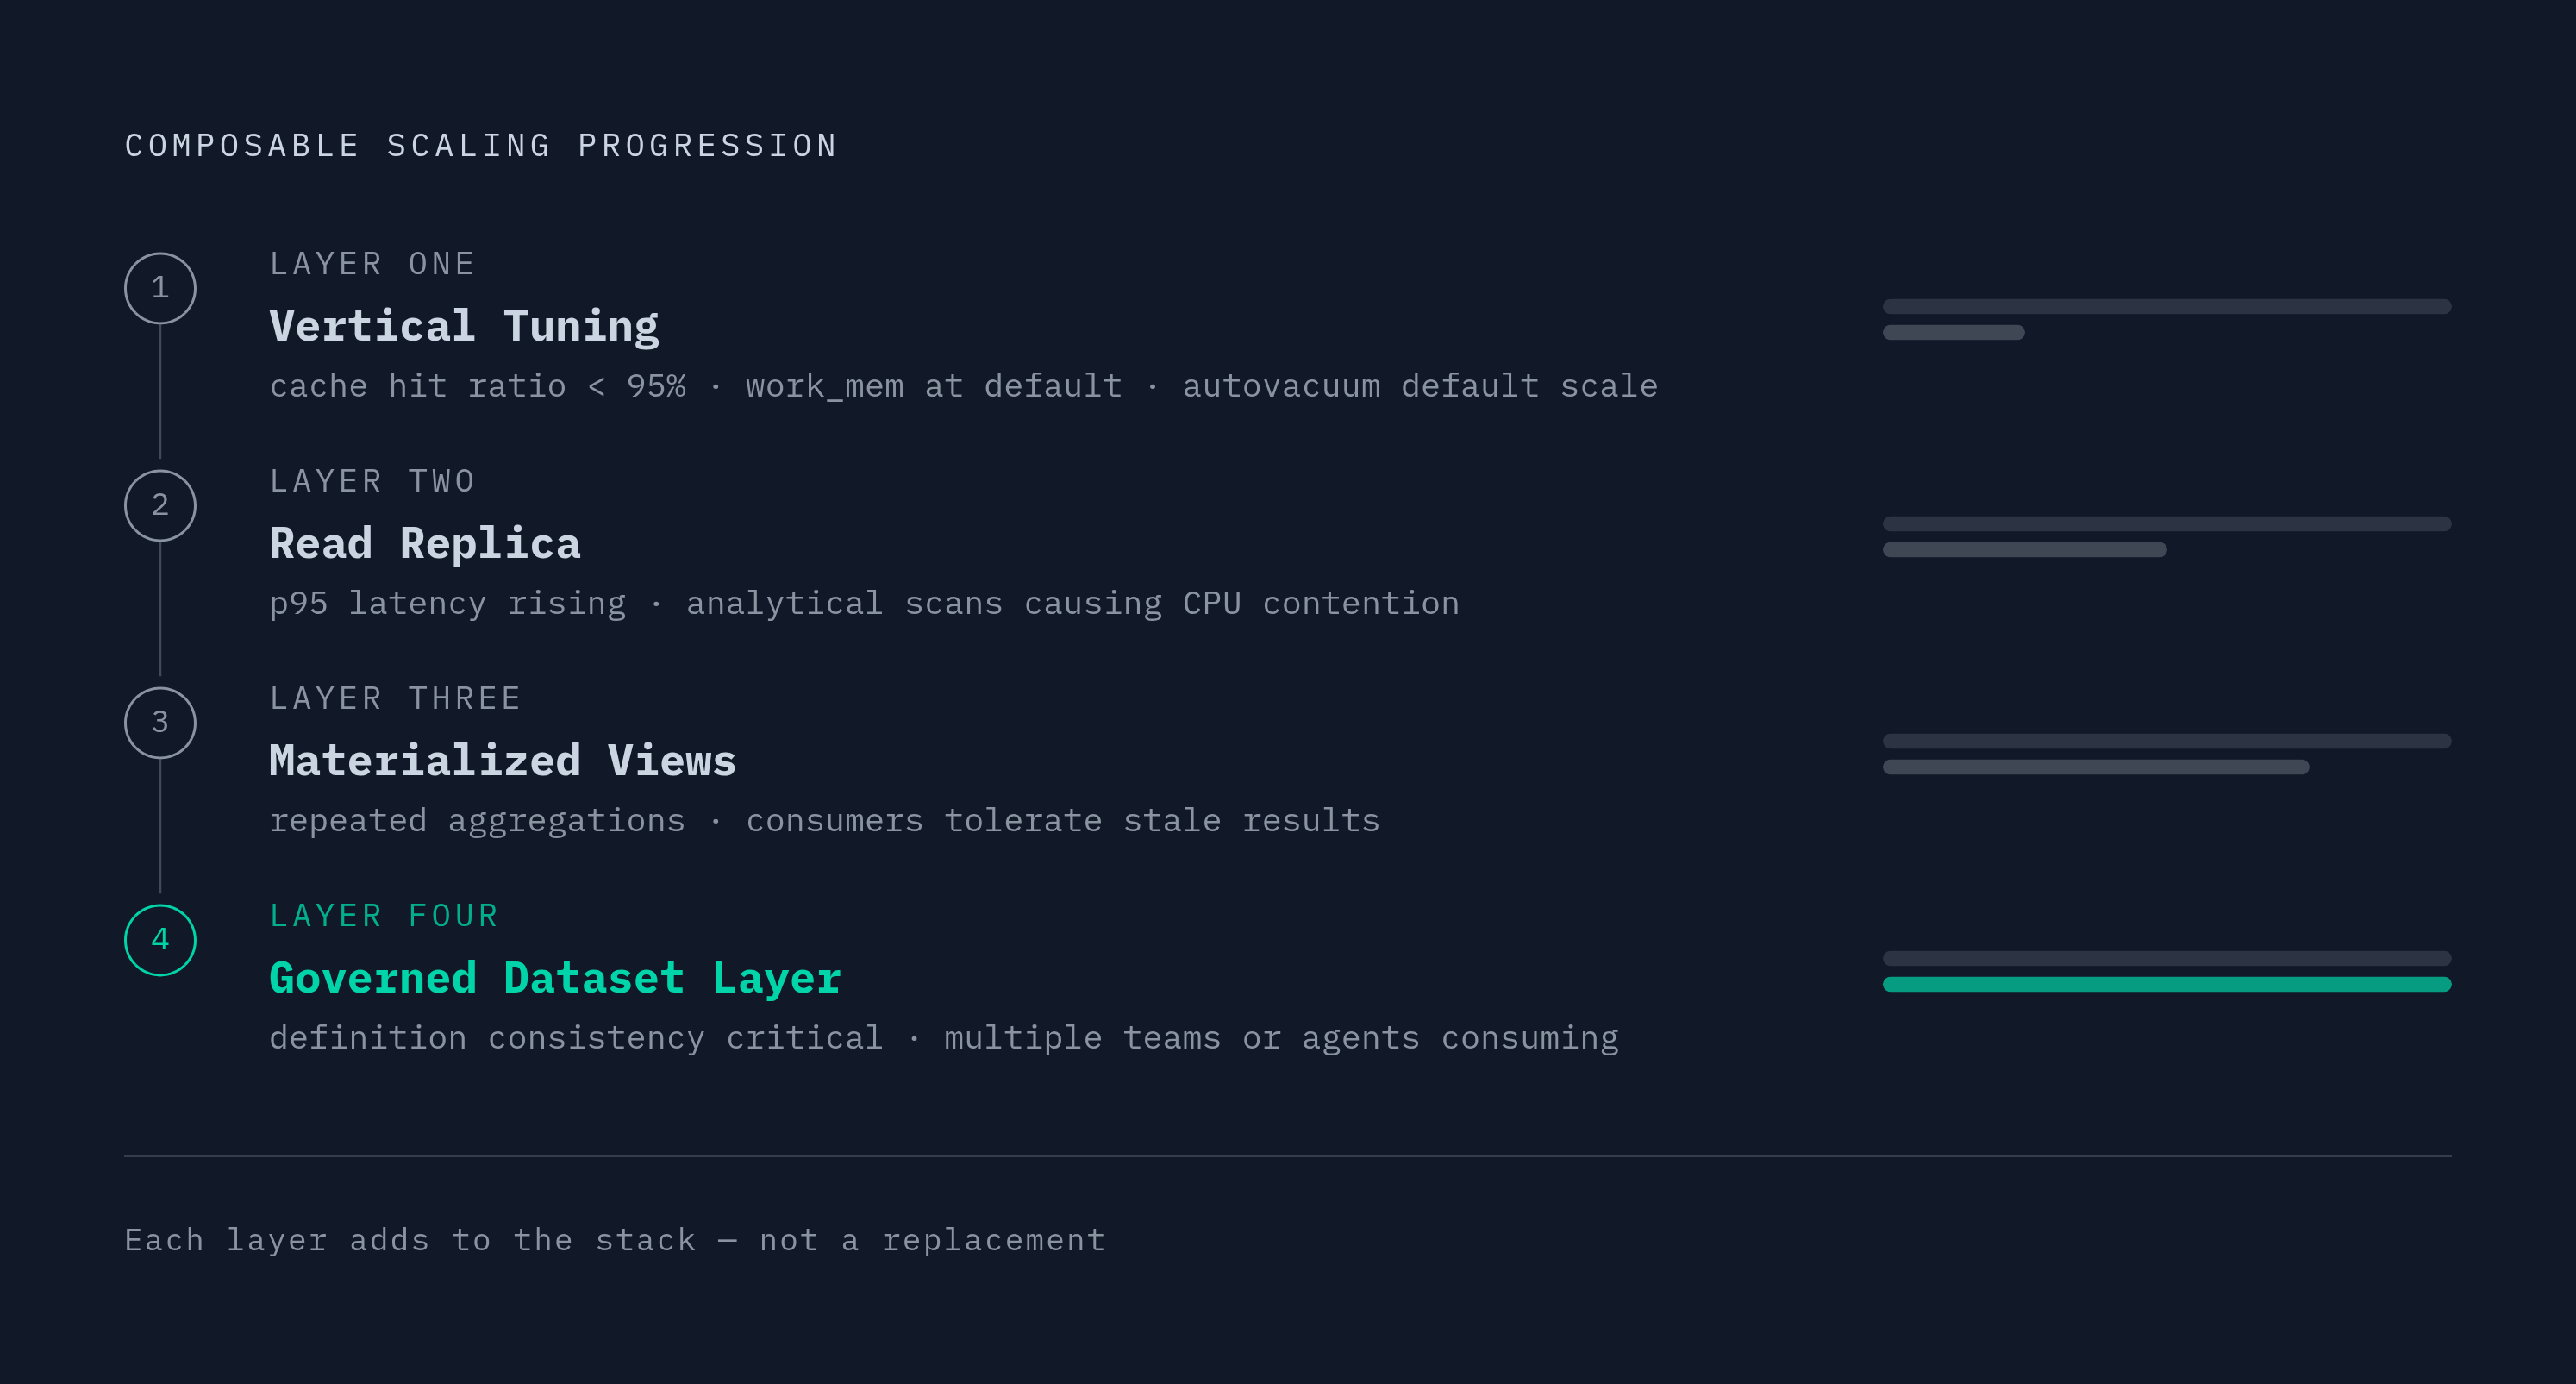
These patterns are composable. Start with tuning when the cache hit ratio is below 95%, work_mem is still at its default, or autovacuum still uses the default scale factors. Add a read replica when user-facing p95 latency rises despite healthy cache ratios and concurrent analytical scans are creating CPU contention.
Layer materialized views onto that design when the same aggregations run frequently and their consumers can tolerate stale results. Move shared metrics into a governed dataset layer when definition consistency matters as much as performance, particularly when multiple teams or agents consume them. Recurring work on refresh schedules and routing logic is another reason to consider that boundary.
The choice should follow the active bottleneck. A production system can need several of those remedies at once. Separating reads from transactional Postgres succeeds when the primary is shielded from analytical demand and consumers receive results suited to their freshness and consistency needs. A warehouse is not a prerequisite for either outcome.