Operational Analytics Patterns for Postgres-Native Teams
How Postgres-native teams should pre-calculate metrics instead of querying production.
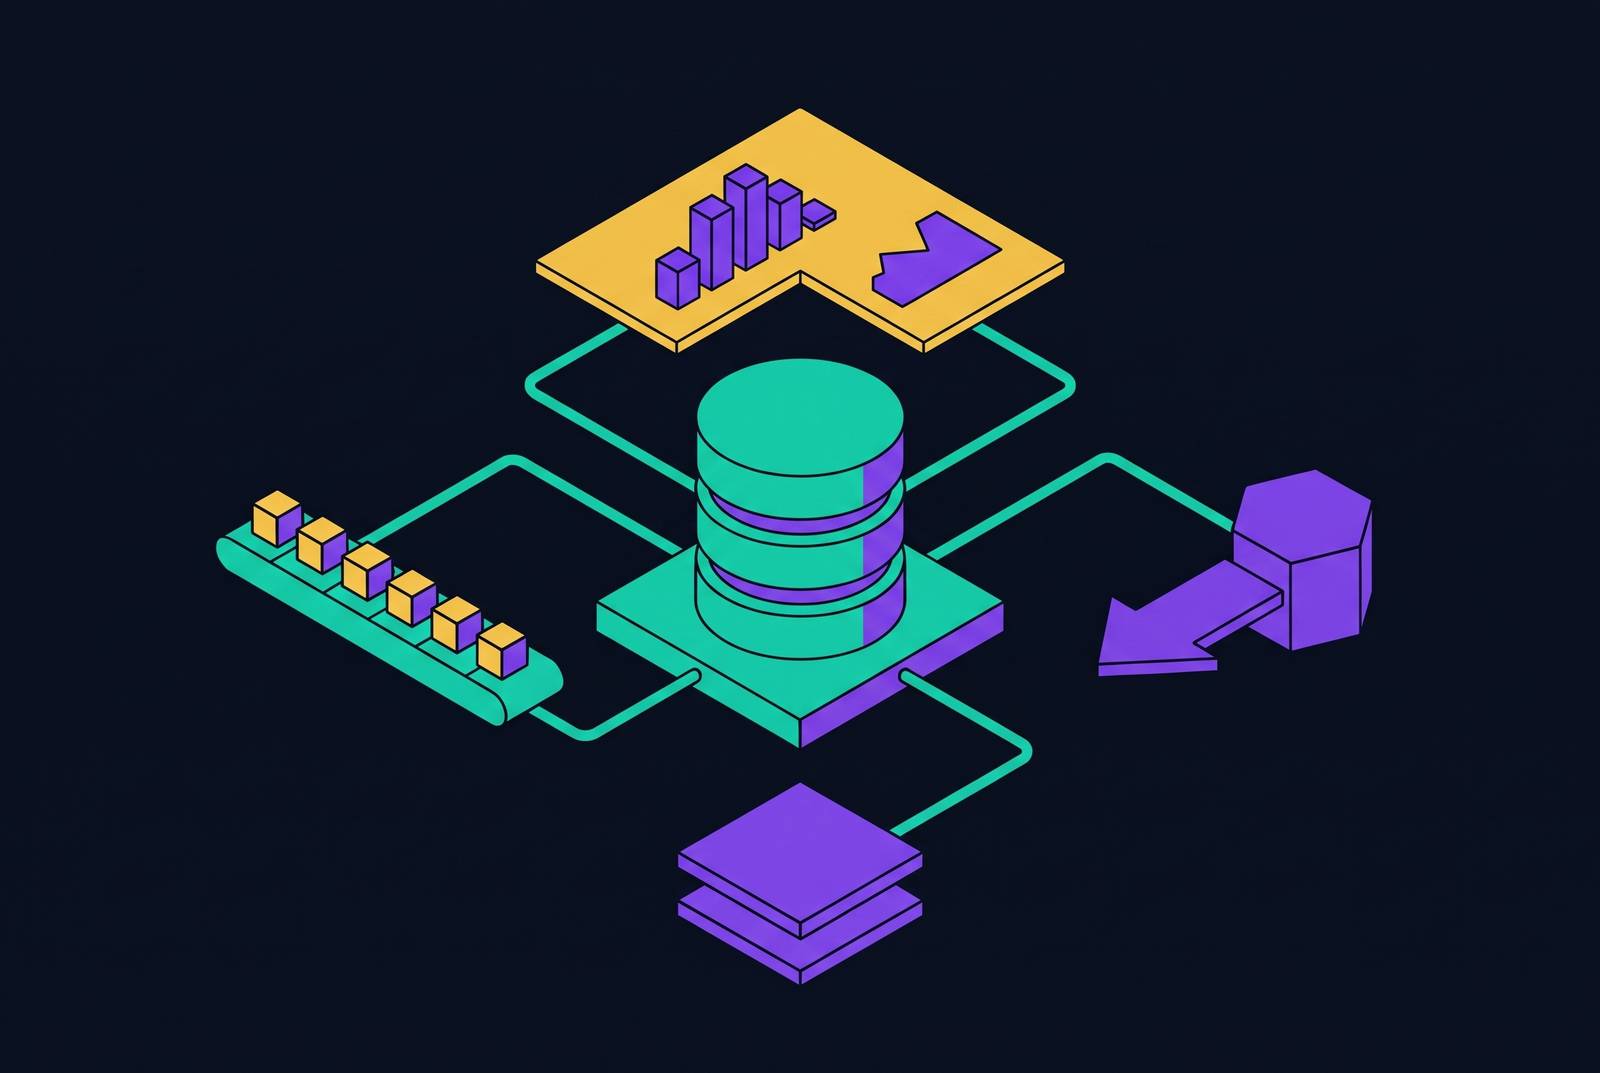
Operational analytics for Postgres-native teams needs a headless analytics backend that pre-calculates governed metrics and exposes them through APIs and MCP, without requiring a prebuilt dashboard UI. Separating analytical access from production traffic does not require extracting data into a warehouse. With this architecture, human teammates and AI agents get numbers they can trust from the same definitions.
Why Postgres-native teams face a specific analytics problem that moving data elsewhere doesn't solve
Teams choose Supabase because it gives them real Postgres, with SQL, auth, realtime, and APIs in one control plane. Their application data already has a home. However, the production instance is row-oriented and tuned for fast lookups, inserts, and updates, while analytical queries scan and aggregate large swaths of rows. Those workloads compete with live traffic for CPU and memory. Connection limits, bad indexing, and chatty queries are often where scaling fails first.
A separate warehouse can move analytical work away from production, but it introduces ETL complexity, schema drift, latency, and another system to govern. For a small team, that trade can add more work than the initial analytics requirement warrants. Moving tables does not settle metric definitions. Nor does it decide which consumers should see which results. The practical alternative is to use Postgres’s analytical capabilities with explicit modeling and access boundaries, reserving a warehouse for requirements that justify the additional system.
What "operational analytics" actually means for a Postgres-native team
Operational analytics uses pre-calculated metrics that people can trust to make decisions, instead of running ad-hoc queries against production each time someone asks a question. It serves two consumers at once. Human teammates need numbers they can trust in dashboards, Slack, or their inbox, while agents need structured data without having to invent metric logic. The unit of analytics is therefore a modeled dataset.
For most B2B SaaS startups, the useful starting scope is CAC, LTV, monthly churn, ARR, and gross margin. More metrics add noise before the business has validated its model. Keeping those few numbers consistent is harder. Metric drift occurs when the same question produces different answers depending on who wrote the query, and it can remain unnoticed until an investor asks for audited numbers. This scope is narrower than full BI or open-ended exploration.
The production database is the wrong place to run analytics, and Supabase's own architecture says so
Supabase’s documentation recommends read replicas for complex analytical queries and reserves the primary for user-facing operations. That distinction establishes the constraint for every subsequent pattern. Repeated scans on the primary compete directly with application requests, so analytical access needs a boundary that insulates the transactional workload.
Query-level monitoring identifies slow queries, their causes, and their frequency, while connection-level monitoring shows connection counts, activity, and waiting work. System-level monitoring covers CPU, memory, IO, disk, and replication lag. When active connections get close to max_connections, there is danger, and hot data should have a high cache hit ratio. These signals need to be available from day one.
Supabase Cloud provides performance advisors that check deterministically for performance issues, an Index Advisor that recommends indexes through the dashboard, and log drains for external logging and alerting. Those tools help find problems, but teams also need p50/p95 latency dashboards to decide when to scale. The initial deployment can use a single instance and connection pooling. Read replicas become appropriate when analytics hurts production, geographically distributed users experience high latency, reads dominate the workload, or CPU utilization stays high.
Pre-aggregating metrics into governed datasets: the first and most important pattern
The first shift is to calculate metrics ahead of demand and materialize the results. Without this step, each new analytical request scans the same rows again. A dashboard and an agent asking for monthly churn should read the same pre-calculated record rather than independently reconstructing the calculation. This makes results cheaper to serve while removing an opportunity for their definitions to diverge.
Materialized views provide a practical mechanism inside Postgres by storing the result of an analytical query as a physical table. A refresh can run on a schedule through pg_cron or an external scheduler. Calculation then happens at a defined interval. When the primary performs that refresh, it bears the calculation cost at refresh time. A separate read layer takes on the work of serving those results to consumers.
For self-hosted teams, pg_duckdb offers another analytical execution option by embedding DuckDB’s columnar-vectorized engine inside Postgres. Supabase acquired Hydra, the extension’s co-developers, to build Supabase Warehouse, signaling investment in embedded analytics. Availability is a firm constraint, however. pg_duckdb is not available on managed Supabase because Supabase Cloud teams cannot install custom extensions that embed another execution engine. Pre-aggregation remains useful without it.
Governance also requires more than a stored result. Each metric needs a definition, an owner, a refresh schedule, and a record of its last update. These attributes let both humans and agents assess what a number means and how fresh it is. No matter which engine does the calculation, running it faster cannot supply that context.
Maintaining a governed read layer that separates analytical access from the production instance
A governed read layer makes pre-calculated metrics available without giving consumers a path to modify source data or query the production primary directly. It combines workload separation with an access boundary. A dedicated read replica keeps the workloads physically separate, while a separate schema can organize materialized datasets but cannot keep them from using production CPU and memory. Pre-calculated results stored as Parquet and queried through DuckDB are another serving option where that arrangement fits the team’s requirements.
Consumer access must be read-only and role-scoped to this layer. Every query reaching it needs an audit record so that a reported number can be traced to the query that retrieved it. These controls belong inside the access layer. They cannot depend on a dashboard or agent voluntarily applying the right restrictions.
Supabase’s row-level security can scope what different roles see, but complex policies impose a performance tax and need performance-conscious design from the start. That caveat does not change the architectural requirement. The same governed definitions must serve every authorized consumer.
Why agents querying production Postgres directly is a category error, not just a security risk
An agent querying live application tables receives raw records. It must choose which revenue column to use, which date filter applies, and how to calculate the requested metric. Read-only credentials do not resolve that ambiguity. The agent is being asked to define the business logic when its actual task is to consume a defined result.
Row-level security built for human roles may not work correctly for agent identities, and prompt injection can trick agents into trying to do things beyond their intended permissions. Model behavior is not an authorization boundary. Permission checks must happen before the tool call executes, outside the agent’s discretion.
Uchibeke et al. (2026) characterize this gap as a failure to authorize actions before execution, distinguishing deterministic enforcement from probabilistic model safety and retrospective evaluation. The research found high social-engineering success against a permissive policy, while a deterministic pre-action authorization policy reduced success to zero in its test setting. That finding supports enforcement before execution.
For this architecture, the design rule is that agents must never touch production Postgres directly. Each agent receives a scoped identity with least-privilege read access to the governed layer only. Infrastructure records every query without relying on the agent to report what it did. The audit trail must also stay outside the agent’s write path so the consumer cannot change the record of what it accessed.
The patterns for exposing governed metrics to agents safely via MCP
The Model Context Protocol gives agents a standard way to connect to the governed read layer. Its three primitives have distinct analytical roles. Tools retrieve metrics or execute queries against the governed layer, while Resources supply schemas, dataset definitions, and metric documentation. Prompts encode repeatable analytical workflows so that recurring questions use consistent definitions. Together, they expose both the result and the context needed to interpret it.
Transport choices affect deployment. The July 2026 MCP specification removed the Mcp-Session-Id header and protocol-level sessions, so requests can reach any server instance without sticky routing or shared session stores. The 2025-03-26 specification deprecated the older SSE transport in favor of Streamable HTTP. New MCP registry listings reject SSE-only implementations.
Endpoint authorization remains an explicit implementation responsibility. OAuth or JWT middleware must protect every endpoint, with the MCP authorization specification recommending Client ID Metadata Documents when client and server have no prior relationship. Tokens need task-specific scopes, and credentials need isolation per agent. Each tool should inherit only the permissions it needs for its task, and endpoint controls must deal with confused-deputy attacks and prompt injection.
Development agents need a separate boundary as well. They must not have access to production credentials, and using synthetic data during prompt tuning lowers the risk of leaks. Across development and production, policy enforcement belongs at the data layer. MCP standardizes access, but trustworthy access depends on the governed layer behind it.
Surfacing metrics where people and agents actually work, not where they have to go look
Scheduled delivery turns governed datasets into information available at the point of a decision. A pull model depends on someone remembering to open a dashboard or initiate a query, and governance applies only if that request uses the governed layer. Push delivery changes that starting point. Metrics are calculated on a schedule and sent from the governed layer to Slack, email, or an agent’s context.
For a Postgres-native team, this can mean a scheduled refresh through pg_cron or an external scheduler followed by a Slack or email delivery. No teammate has to initiate the calculation. For agents, an MCP server can expose pre-calculated metrics as Resources, with the consuming workflow supplying those resources as context at the start of a task. The agent then receives defined numbers rather than assembling its own interpretation from raw tables.
AI-generated narrative reports can work the same way, with the agent reading a pre-modeled dataset and writing a summary. A Slack digest, a dashboard, and a founder’s agent can then use the same records even though they show them in different ways. This is the practical value of a headless analytics backend for API-first and agent-first teams, because delivery can change without changing the underlying definition.
What analytics backend fits a Supabase team that needs raw API access but has no dedicated data engineer?
A Supabase team without a dedicated data engineer needs tooling that handles pre-calculation, governed serving, scoped MCP access, and scheduled delivery without requiring an opinionated frontend. Raw API access alone is not enough. The selection criteria are whether the backend exposes modeled datasets, enforces read-only role scopes, records access, and makes metric definitions and freshness available to consumers.
The team still owns its business definitions. It needs to choose the five or fewer KPIs that drive decisions and specify the logic that makes each trustworthy. Infrastructure for calculating those metrics, maintaining the read layer, exposing MCP, and delivering scheduled results can be delegated to tooling. The distinction is between owning what a number means and operating every component that serves it.
This architecture is achievable without dedicated data engineering headcount when the tooling handles modeling and governance. Without modeled datasets, the first agent with database access invents metric logic, while repeated on-demand queries accumulate against production until a connection-pool crisis forces a retrofit. Instrumentation belongs at the start, with read replicas added as latency and workload signals justify them, including the p95 threshold of 200ms.